Chilean vs Immigrants from Nepal Male Unemployment
COMPARE
Chilean
Immigrants from Nepal
Male Unemployment
Male Unemployment Comparison
Chileans
Immigrants from Nepal
5.0%
MALE UNEMPLOYMENT
96.2/ 100
METRIC RATING
82nd/ 347
METRIC RANK
4.8%
MALE UNEMPLOYMENT
99.8/ 100
METRIC RATING
32nd/ 347
METRIC RANK
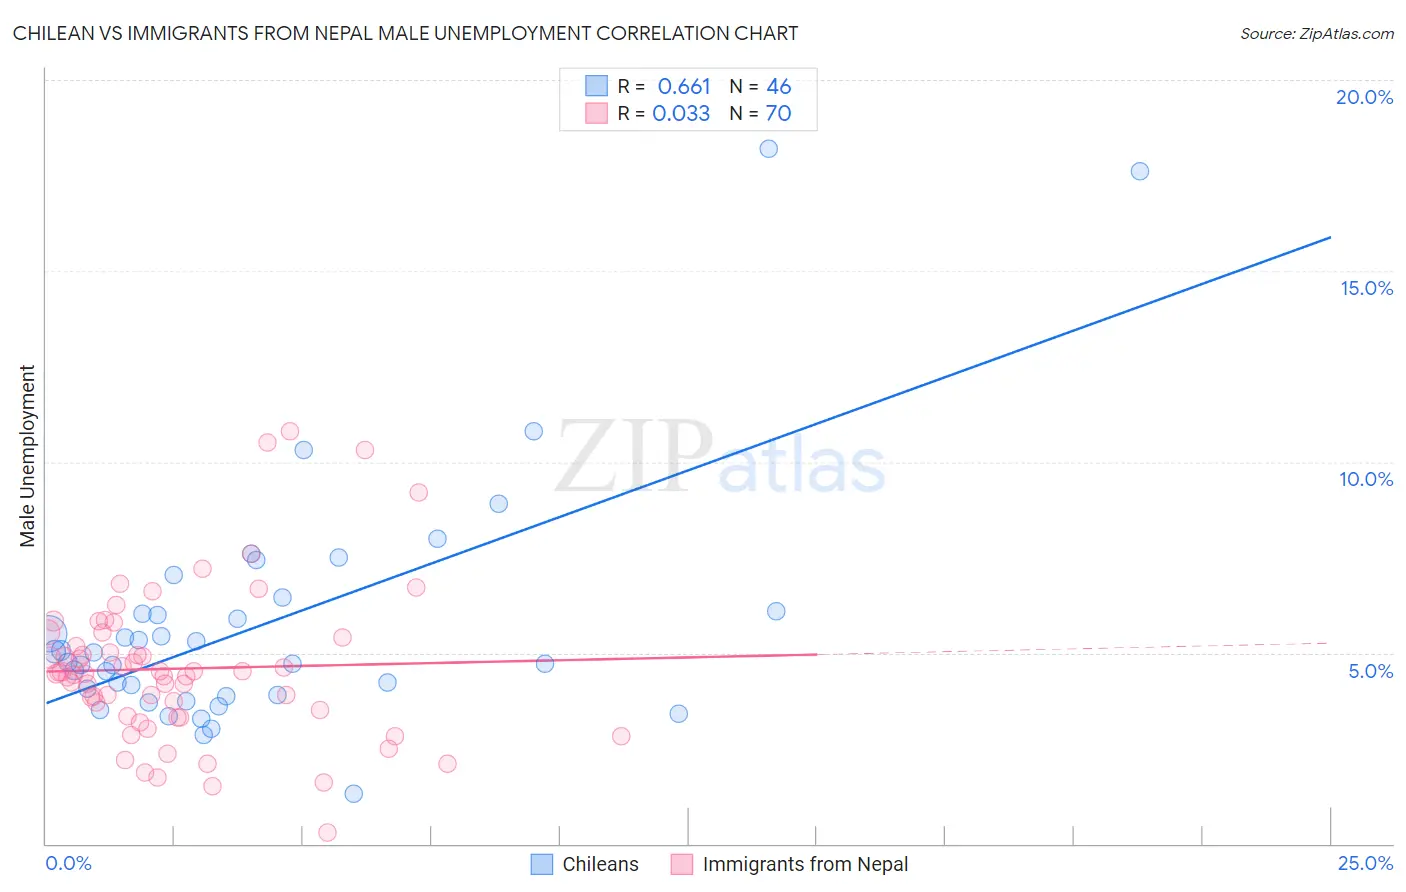
Chilean vs Immigrants from Nepal Male Unemployment Correlation Chart
The statistical analysis conducted on geographies consisting of 256,250,664 people shows a significant positive correlation between the proportion of Chileans and unemployment rate among males in the United States with a correlation coefficient (R) of 0.661 and weighted average of 5.0%. Similarly, the statistical analysis conducted on geographies consisting of 186,501,953 people shows no correlation between the proportion of Immigrants from Nepal and unemployment rate among males in the United States with a correlation coefficient (R) of 0.033 and weighted average of 4.8%, a difference of 4.4%.
Male Unemployment Correlation Summary
| Measurement | Chilean | Immigrants from Nepal |
| Minimum | 1.3% | 0.30% |
| Maximum | 18.2% | 10.8% |
| Range | 16.9% | 10.5% |
| Mean | 5.8% | 4.6% |
| Median | 4.9% | 4.5% |
| Interquartile 25% (IQ1) | 3.9% | 3.4% |
| Interquartile 75% (IQ3) | 6.1% | 5.4% |
| Interquartile Range (IQR) | 2.2% | 2.0% |
| Standard Deviation (Sample) | 3.2% | 2.0% |
| Standard Deviation (Population) | 3.2% | 2.0% |
Similar Demographics by Male Unemployment
Demographics Similar to Chileans by Male Unemployment
In terms of male unemployment, the demographic groups most similar to Chileans are French (5.0%, a difference of 0.030%), Argentinean (5.0%, a difference of 0.040%), Immigrants from Eritrea (5.0%, a difference of 0.060%), South African (5.0%, a difference of 0.090%), and Immigrants from Northern Europe (5.0%, a difference of 0.10%).
| Demographics | Rating | Rank | Male Unemployment |
| Assyrians/Chaldeans/Syriacs | 96.9 /100 | #75 | Exceptional 5.0% |
| Immigrants | Sudan | 96.5 /100 | #76 | Exceptional 5.0% |
| Iranians | 96.4 /100 | #77 | Exceptional 5.0% |
| Immigrants | Northern Europe | 96.4 /100 | #78 | Exceptional 5.0% |
| South Africans | 96.4 /100 | #79 | Exceptional 5.0% |
| Argentineans | 96.2 /100 | #80 | Exceptional 5.0% |
| French | 96.2 /100 | #81 | Exceptional 5.0% |
| Chileans | 96.2 /100 | #82 | Exceptional 5.0% |
| Immigrants | Eritrea | 96.0 /100 | #83 | Exceptional 5.0% |
| Serbians | 95.7 /100 | #84 | Exceptional 5.1% |
| Immigrants | North Macedonia | 95.6 /100 | #85 | Exceptional 5.1% |
| Maltese | 95.5 /100 | #86 | Exceptional 5.1% |
| Immigrants | Romania | 95.4 /100 | #87 | Exceptional 5.1% |
| Immigrants | Sri Lanka | 94.9 /100 | #88 | Exceptional 5.1% |
| Immigrants | Australia | 94.7 /100 | #89 | Exceptional 5.1% |
Demographics Similar to Immigrants from Nepal by Male Unemployment
In terms of male unemployment, the demographic groups most similar to Immigrants from Nepal are Sudanese (4.8%, a difference of 0.010%), British (4.8%, a difference of 0.26%), Latvian (4.8%, a difference of 0.30%), Welsh (4.8%, a difference of 0.38%), and Scottish (4.8%, a difference of 0.57%).
| Demographics | Rating | Rank | Male Unemployment |
| Zimbabweans | 99.9 /100 | #25 | Exceptional 4.8% |
| Dutch | 99.9 /100 | #26 | Exceptional 4.8% |
| Belgians | 99.9 /100 | #27 | Exceptional 4.8% |
| Bulgarians | 99.8 /100 | #28 | Exceptional 4.8% |
| Scottish | 99.8 /100 | #29 | Exceptional 4.8% |
| British | 99.8 /100 | #30 | Exceptional 4.8% |
| Sudanese | 99.8 /100 | #31 | Exceptional 4.8% |
| Immigrants | Nepal | 99.8 /100 | #32 | Exceptional 4.8% |
| Latvians | 99.7 /100 | #33 | Exceptional 4.8% |
| Welsh | 99.7 /100 | #34 | Exceptional 4.8% |
| Paraguayans | 99.5 /100 | #35 | Exceptional 4.9% |
| Immigrants | Singapore | 99.4 /100 | #36 | Exceptional 4.9% |
| Scotch-Irish | 99.4 /100 | #37 | Exceptional 4.9% |
| Immigrants | Bosnia and Herzegovina | 99.4 /100 | #38 | Exceptional 4.9% |
| Burmese | 99.3 /100 | #39 | Exceptional 4.9% |