Lithuanian vs Immigrants from Nepal Male Unemployment
COMPARE
Lithuanian
Immigrants from Nepal
Male Unemployment
Male Unemployment Comparison
Lithuanians
Immigrants from Nepal
5.0%
MALE UNEMPLOYMENT
98.5/ 100
METRIC RATING
58th/ 347
METRIC RANK
4.8%
MALE UNEMPLOYMENT
99.8/ 100
METRIC RATING
32nd/ 347
METRIC RANK
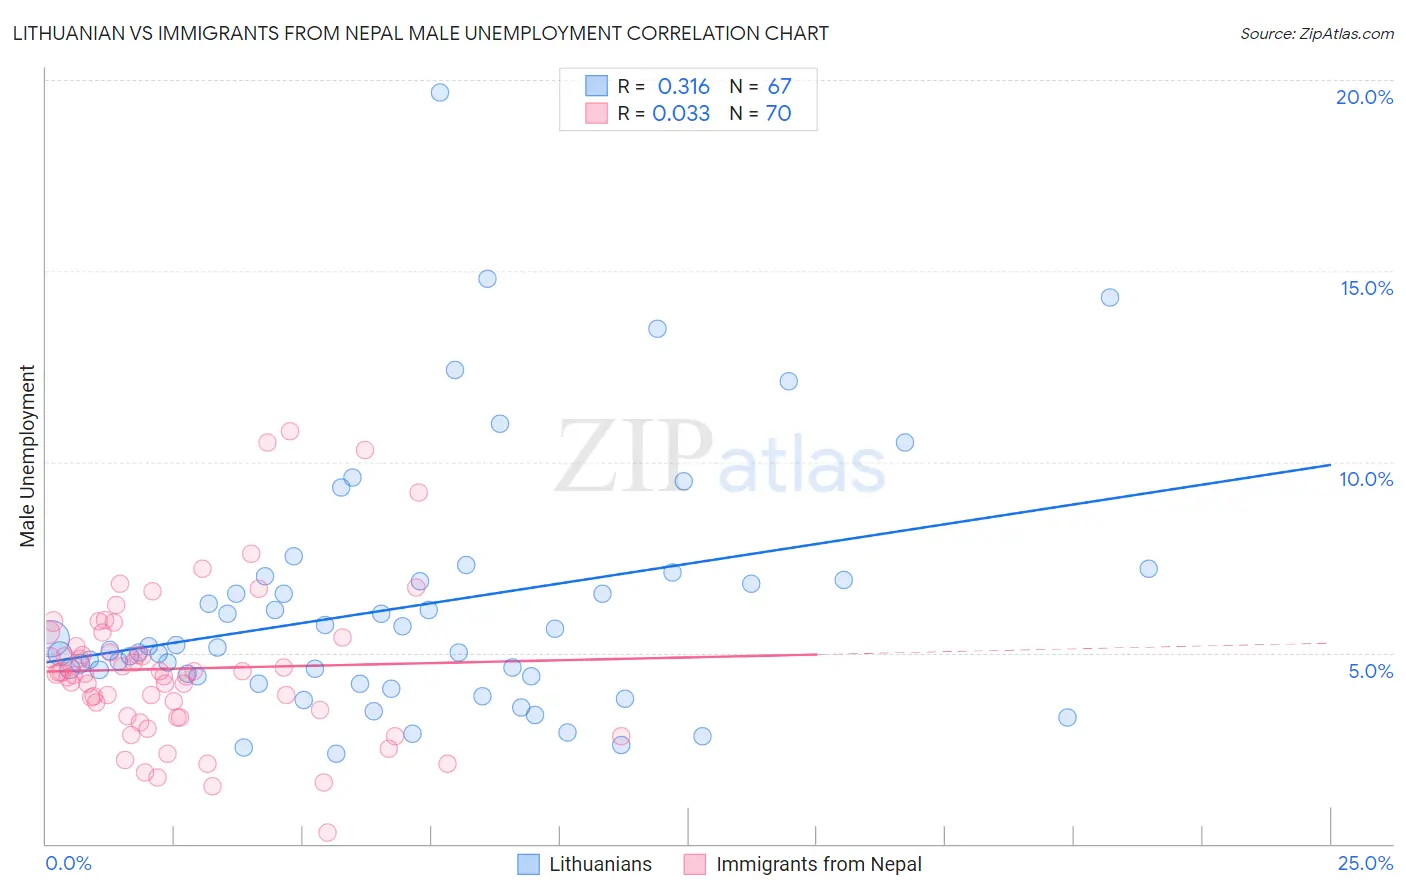
Lithuanian vs Immigrants from Nepal Male Unemployment Correlation Chart
The statistical analysis conducted on geographies consisting of 419,508,193 people shows a mild positive correlation between the proportion of Lithuanians and unemployment rate among males in the United States with a correlation coefficient (R) of 0.316 and weighted average of 5.0%. Similarly, the statistical analysis conducted on geographies consisting of 186,501,953 people shows no correlation between the proportion of Immigrants from Nepal and unemployment rate among males in the United States with a correlation coefficient (R) of 0.033 and weighted average of 4.8%, a difference of 2.9%.
Male Unemployment Correlation Summary
| Measurement | Lithuanian | Immigrants from Nepal |
| Minimum | 2.4% | 0.30% |
| Maximum | 19.7% | 10.8% |
| Range | 17.3% | 10.5% |
| Mean | 6.2% | 4.6% |
| Median | 5.2% | 4.5% |
| Interquartile 25% (IQ1) | 4.4% | 3.4% |
| Interquartile 75% (IQ3) | 6.9% | 5.4% |
| Interquartile Range (IQR) | 2.5% | 2.0% |
| Standard Deviation (Sample) | 3.3% | 2.0% |
| Standard Deviation (Population) | 3.2% | 2.0% |
Similar Demographics by Male Unemployment
Demographics Similar to Lithuanians by Male Unemployment
In terms of male unemployment, the demographic groups most similar to Lithuanians are Turkish (5.0%, a difference of 0.0%), Immigrants from Netherlands (5.0%, a difference of 0.14%), Immigrants from Bulgaria (5.0%, a difference of 0.23%), Yugoslavian (5.0%, a difference of 0.24%), and Czechoslovakian (5.0%, a difference of 0.24%).
| Demographics | Rating | Rank | Male Unemployment |
| Slovenes | 98.8 /100 | #51 | Exceptional 5.0% |
| Irish | 98.8 /100 | #52 | Exceptional 5.0% |
| Jordanians | 98.8 /100 | #53 | Exceptional 5.0% |
| Yugoslavians | 98.7 /100 | #54 | Exceptional 5.0% |
| Czechoslovakians | 98.7 /100 | #55 | Exceptional 5.0% |
| Immigrants | Bulgaria | 98.7 /100 | #56 | Exceptional 5.0% |
| Turks | 98.5 /100 | #57 | Exceptional 5.0% |
| Lithuanians | 98.5 /100 | #58 | Exceptional 5.0% |
| Immigrants | Netherlands | 98.3 /100 | #59 | Exceptional 5.0% |
| Immigrants | Argentina | 98.1 /100 | #60 | Exceptional 5.0% |
| Cambodians | 98.1 /100 | #61 | Exceptional 5.0% |
| Basques | 97.9 /100 | #62 | Exceptional 5.0% |
| Eastern Europeans | 97.9 /100 | #63 | Exceptional 5.0% |
| Celtics | 97.8 /100 | #64 | Exceptional 5.0% |
| Icelanders | 97.6 /100 | #65 | Exceptional 5.0% |
Demographics Similar to Immigrants from Nepal by Male Unemployment
In terms of male unemployment, the demographic groups most similar to Immigrants from Nepal are Sudanese (4.8%, a difference of 0.010%), British (4.8%, a difference of 0.26%), Latvian (4.8%, a difference of 0.30%), Welsh (4.8%, a difference of 0.38%), and Scottish (4.8%, a difference of 0.57%).
| Demographics | Rating | Rank | Male Unemployment |
| Zimbabweans | 99.9 /100 | #25 | Exceptional 4.8% |
| Dutch | 99.9 /100 | #26 | Exceptional 4.8% |
| Belgians | 99.9 /100 | #27 | Exceptional 4.8% |
| Bulgarians | 99.8 /100 | #28 | Exceptional 4.8% |
| Scottish | 99.8 /100 | #29 | Exceptional 4.8% |
| British | 99.8 /100 | #30 | Exceptional 4.8% |
| Sudanese | 99.8 /100 | #31 | Exceptional 4.8% |
| Immigrants | Nepal | 99.8 /100 | #32 | Exceptional 4.8% |
| Latvians | 99.7 /100 | #33 | Exceptional 4.8% |
| Welsh | 99.7 /100 | #34 | Exceptional 4.8% |
| Paraguayans | 99.5 /100 | #35 | Exceptional 4.9% |
| Immigrants | Singapore | 99.4 /100 | #36 | Exceptional 4.9% |
| Scotch-Irish | 99.4 /100 | #37 | Exceptional 4.9% |
| Immigrants | Bosnia and Herzegovina | 99.4 /100 | #38 | Exceptional 4.9% |
| Burmese | 99.3 /100 | #39 | Exceptional 4.9% |