Romanian vs Immigrants from Cameroon Male Unemployment
COMPARE
Romanian
Immigrants from Cameroon
Male Unemployment
Male Unemployment Comparison
Romanians
Immigrants from Cameroon
5.1%
MALE UNEMPLOYMENT
89.8/ 100
METRIC RATING
114th/ 347
METRIC RANK
5.6%
MALE UNEMPLOYMENT
1.0/ 100
METRIC RATING
240th/ 347
METRIC RANK
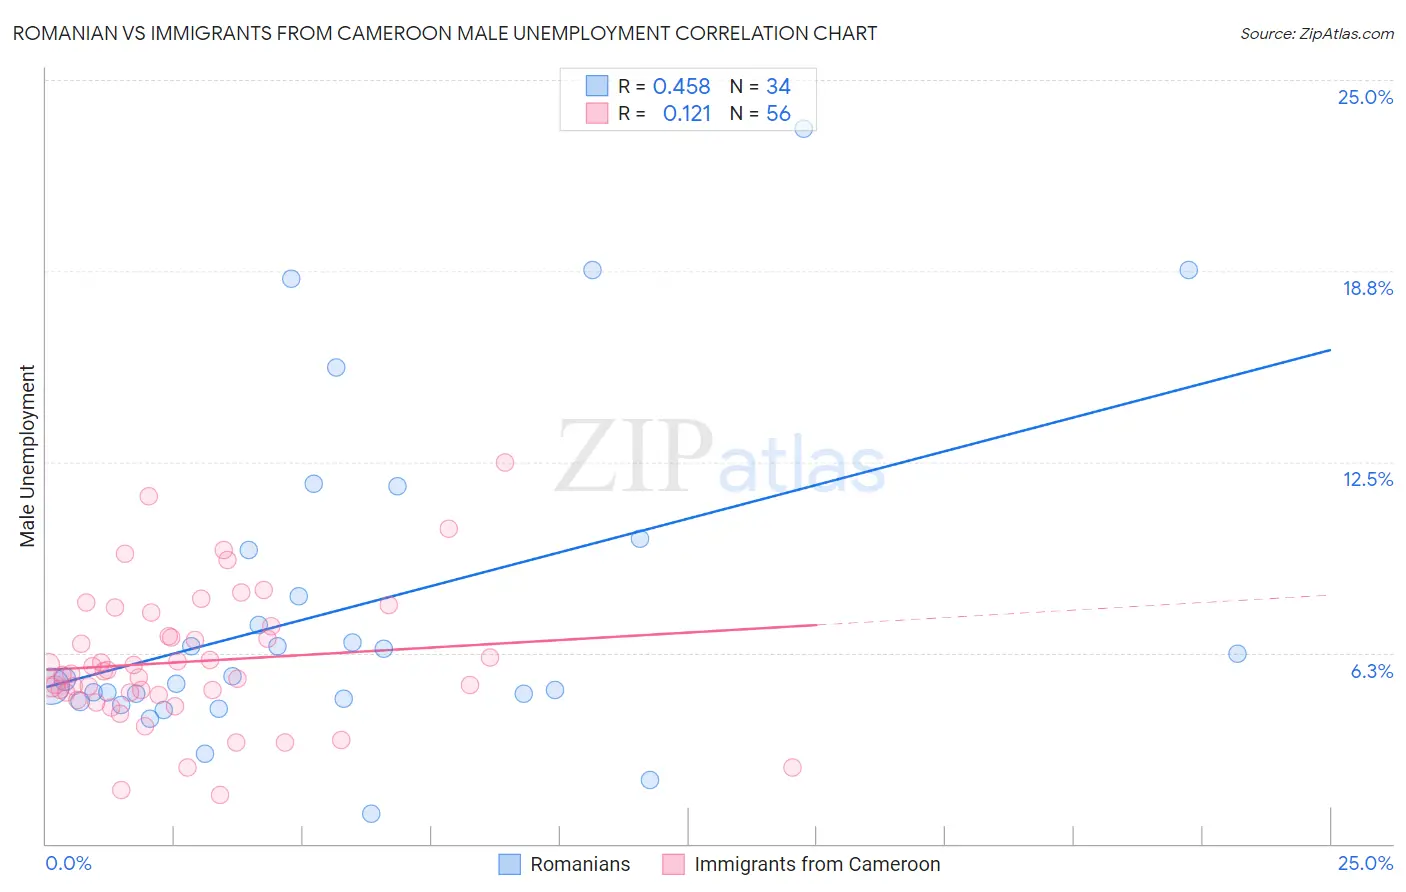
Romanian vs Immigrants from Cameroon Male Unemployment Correlation Chart
The statistical analysis conducted on geographies consisting of 376,462,123 people shows a moderate positive correlation between the proportion of Romanians and unemployment rate among males in the United States with a correlation coefficient (R) of 0.458 and weighted average of 5.1%. Similarly, the statistical analysis conducted on geographies consisting of 130,586,445 people shows a poor positive correlation between the proportion of Immigrants from Cameroon and unemployment rate among males in the United States with a correlation coefficient (R) of 0.121 and weighted average of 5.6%, a difference of 10.2%.
Male Unemployment Correlation Summary
| Measurement | Romanian | Immigrants from Cameroon |
| Minimum | 1.0% | 1.6% |
| Maximum | 23.4% | 12.5% |
| Range | 22.4% | 10.9% |
| Mean | 7.8% | 6.0% |
| Median | 5.4% | 5.6% |
| Interquartile 25% (IQ1) | 4.7% | 4.9% |
| Interquartile 75% (IQ3) | 9.6% | 7.0% |
| Interquartile Range (IQR) | 4.9% | 2.0% |
| Standard Deviation (Sample) | 5.3% | 2.2% |
| Standard Deviation (Population) | 5.3% | 2.2% |
Similar Demographics by Male Unemployment
Demographics Similar to Romanians by Male Unemployment
In terms of male unemployment, the demographic groups most similar to Romanians are Immigrants from Asia (5.1%, a difference of 0.030%), Immigrants from Denmark (5.1%, a difference of 0.070%), Immigrants from Moldova (5.1%, a difference of 0.080%), Immigrants from Austria (5.1%, a difference of 0.080%), and Estonian (5.1%, a difference of 0.12%).
| Demographics | Rating | Rank | Male Unemployment |
| Ethiopians | 91.3 /100 | #107 | Exceptional 5.1% |
| Immigrants | Nicaragua | 91.2 /100 | #108 | Exceptional 5.1% |
| Immigrants | Pakistan | 90.9 /100 | #109 | Exceptional 5.1% |
| Immigrants | England | 90.8 /100 | #110 | Exceptional 5.1% |
| Immigrants | Eastern Asia | 90.8 /100 | #111 | Exceptional 5.1% |
| Immigrants | Moldova | 90.3 /100 | #112 | Exceptional 5.1% |
| Immigrants | Austria | 90.3 /100 | #113 | Exceptional 5.1% |
| Romanians | 89.8 /100 | #114 | Excellent 5.1% |
| Immigrants | Asia | 89.6 /100 | #115 | Excellent 5.1% |
| Immigrants | Denmark | 89.4 /100 | #116 | Excellent 5.1% |
| Estonians | 89.0 /100 | #117 | Excellent 5.1% |
| Cypriots | 88.8 /100 | #118 | Excellent 5.1% |
| French Canadians | 88.6 /100 | #119 | Excellent 5.1% |
| Ukrainians | 88.4 /100 | #120 | Excellent 5.1% |
| Mongolians | 88.4 /100 | #121 | Excellent 5.1% |
Demographics Similar to Immigrants from Cameroon by Male Unemployment
In terms of male unemployment, the demographic groups most similar to Immigrants from Cameroon are Salvadoran (5.7%, a difference of 0.040%), Native Hawaiian (5.6%, a difference of 0.070%), Immigrants from Guatemala (5.6%, a difference of 0.070%), Ottawa (5.7%, a difference of 0.11%), and Honduran (5.6%, a difference of 0.12%).
| Demographics | Rating | Rank | Male Unemployment |
| Somalis | 1.5 /100 | #233 | Tragic 5.6% |
| Immigrants | Somalia | 1.5 /100 | #234 | Tragic 5.6% |
| Immigrants | Honduras | 1.5 /100 | #235 | Tragic 5.6% |
| Guatemalans | 1.2 /100 | #236 | Tragic 5.6% |
| Hondurans | 1.1 /100 | #237 | Tragic 5.6% |
| Native Hawaiians | 1.1 /100 | #238 | Tragic 5.6% |
| Immigrants | Guatemala | 1.1 /100 | #239 | Tragic 5.6% |
| Immigrants | Cameroon | 1.0 /100 | #240 | Tragic 5.6% |
| Salvadorans | 1.0 /100 | #241 | Tragic 5.7% |
| Ottawa | 0.9 /100 | #242 | Tragic 5.7% |
| Bangladeshis | 0.8 /100 | #243 | Tragic 5.7% |
| Immigrants | El Salvador | 0.7 /100 | #244 | Tragic 5.7% |
| Yaqui | 0.7 /100 | #245 | Tragic 5.7% |
| Iroquois | 0.6 /100 | #246 | Tragic 5.7% |
| Hawaiians | 0.6 /100 | #247 | Tragic 5.7% |