Celtic vs Thai Unemployment Among Ages 30 to 34 years
COMPARE
Celtic
Thai
Unemployment Among Ages 30 to 34 years
Unemployment Among Ages 30 to 34 years Comparison
Celtics
Thais
5.4%
UNEMPLOYMENT AMONG AGES 30 TO 34 YEARS
70.2/ 100
METRIC RATING
146th/ 347
METRIC RANK
4.7%
UNEMPLOYMENT AMONG AGES 30 TO 34 YEARS
100.0/ 100
METRIC RATING
7th/ 347
METRIC RANK
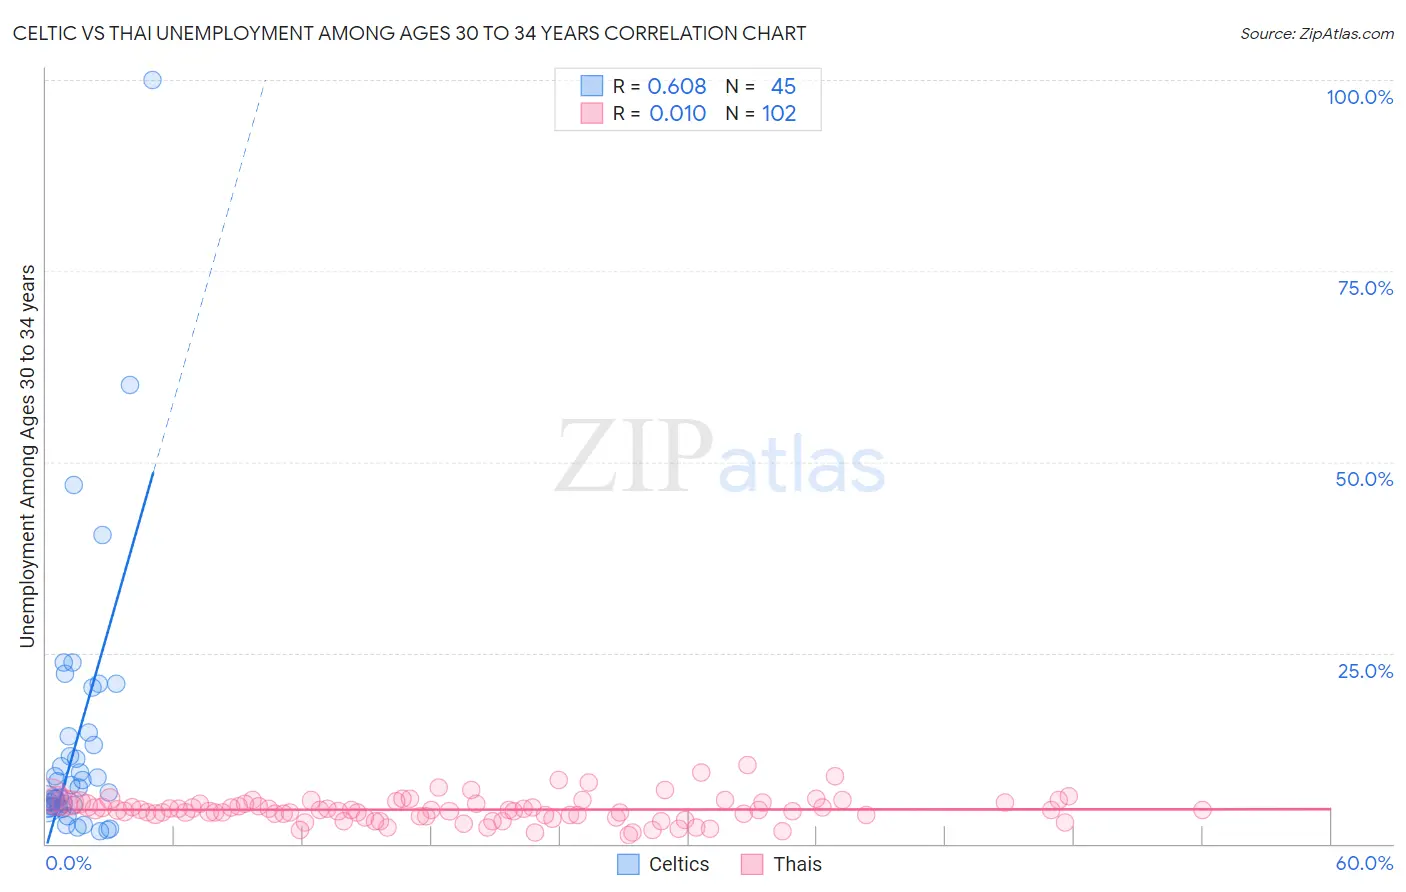
Celtic vs Thai Unemployment Among Ages 30 to 34 years Correlation Chart
The statistical analysis conducted on geographies consisting of 162,939,581 people shows a significant positive correlation between the proportion of Celtics and unemployment rate among population between the ages 30 and 34 in the United States with a correlation coefficient (R) of 0.608 and weighted average of 5.4%. Similarly, the statistical analysis conducted on geographies consisting of 441,217,021 people shows no correlation between the proportion of Thais and unemployment rate among population between the ages 30 and 34 in the United States with a correlation coefficient (R) of 0.010 and weighted average of 4.7%, a difference of 14.0%.
Unemployment Among Ages 30 to 34 years Correlation Summary
| Measurement | Celtic | Thai |
| Minimum | 1.6% | 1.1% |
| Maximum | 100.0% | 10.3% |
| Range | 98.4% | 9.2% |
| Mean | 13.5% | 4.5% |
| Median | 7.4% | 4.4% |
| Interquartile 25% (IQ1) | 4.8% | 3.6% |
| Interquartile 75% (IQ3) | 14.4% | 5.3% |
| Interquartile Range (IQR) | 9.5% | 1.7% |
| Standard Deviation (Sample) | 17.9% | 1.7% |
| Standard Deviation (Population) | 17.7% | 1.6% |
Similar Demographics by Unemployment Among Ages 30 to 34 years
Demographics Similar to Celtics by Unemployment Among Ages 30 to 34 years
In terms of unemployment among ages 30 to 34 years, the demographic groups most similar to Celtics are Syrian (5.4%, a difference of 0.010%), Immigrants from Russia (5.4%, a difference of 0.060%), Russian (5.4%, a difference of 0.080%), Ukrainian (5.4%, a difference of 0.080%), and Immigrants from Iran (5.4%, a difference of 0.090%).
| Demographics | Rating | Rank | Unemployment Among Ages 30 to 34 years |
| Lithuanians | 72.4 /100 | #139 | Good 5.4% |
| Immigrants | North America | 72.2 /100 | #140 | Good 5.4% |
| Immigrants | Europe | 72.1 /100 | #141 | Good 5.4% |
| Immigrants | Greece | 72.0 /100 | #142 | Good 5.4% |
| Russians | 71.1 /100 | #143 | Good 5.4% |
| Immigrants | Russia | 71.0 /100 | #144 | Good 5.4% |
| Syrians | 70.3 /100 | #145 | Good 5.4% |
| Celtics | 70.2 /100 | #146 | Good 5.4% |
| Ukrainians | 69.2 /100 | #147 | Good 5.4% |
| Immigrants | Iran | 69.1 /100 | #148 | Good 5.4% |
| Immigrants | Colombia | 68.9 /100 | #149 | Good 5.4% |
| Colombians | 68.7 /100 | #150 | Good 5.4% |
| Immigrants | Oceania | 68.1 /100 | #151 | Good 5.4% |
| Lebanese | 67.2 /100 | #152 | Good 5.4% |
| Immigrants | South Eastern Asia | 66.5 /100 | #153 | Good 5.4% |
Demographics Similar to Thais by Unemployment Among Ages 30 to 34 years
In terms of unemployment among ages 30 to 34 years, the demographic groups most similar to Thais are Immigrants from Eritrea (4.7%, a difference of 0.18%), Immigrants from Bosnia and Herzegovina (4.7%, a difference of 0.20%), Venezuelan (4.7%, a difference of 0.43%), Bulgarian (4.7%, a difference of 0.49%), and Tongan (4.8%, a difference of 0.67%).
| Demographics | Rating | Rank | Unemployment Among Ages 30 to 34 years |
| Immigrants | India | 100.0 /100 | #1 | Exceptional 4.5% |
| Sudanese | 100.0 /100 | #2 | Exceptional 4.6% |
| Immigrants | Venezuela | 100.0 /100 | #3 | Exceptional 4.6% |
| Immigrants | Nepal | 100.0 /100 | #4 | Exceptional 4.7% |
| Venezuelans | 100.0 /100 | #5 | Exceptional 4.7% |
| Immigrants | Bosnia and Herzegovina | 100.0 /100 | #6 | Exceptional 4.7% |
| Thais | 100.0 /100 | #7 | Exceptional 4.7% |
| Immigrants | Eritrea | 100.0 /100 | #8 | Exceptional 4.7% |
| Bulgarians | 99.9 /100 | #9 | Exceptional 4.7% |
| Tongans | 99.9 /100 | #10 | Exceptional 4.8% |
| Immigrants | Bolivia | 99.9 /100 | #11 | Exceptional 4.8% |
| Filipinos | 99.9 /100 | #12 | Exceptional 4.8% |
| Cambodians | 99.9 /100 | #13 | Exceptional 4.8% |
| Luxembourgers | 99.9 /100 | #14 | Exceptional 4.8% |
| Okinawans | 99.9 /100 | #15 | Exceptional 4.8% |