Puerto Rican vs Immigrants from Russia Unemployment Among Ages 30 to 34 years
COMPARE
Puerto Rican
Immigrants from Russia
Unemployment Among Ages 30 to 34 years
Unemployment Among Ages 30 to 34 years Comparison
Puerto Ricans
Immigrants from Russia
8.9%
UNEMPLOYMENT AMONG AGES 30 TO 34 YEARS
0.0/ 100
METRIC RATING
335th/ 347
METRIC RANK
5.4%
UNEMPLOYMENT AMONG AGES 30 TO 34 YEARS
71.0/ 100
METRIC RATING
144th/ 347
METRIC RANK
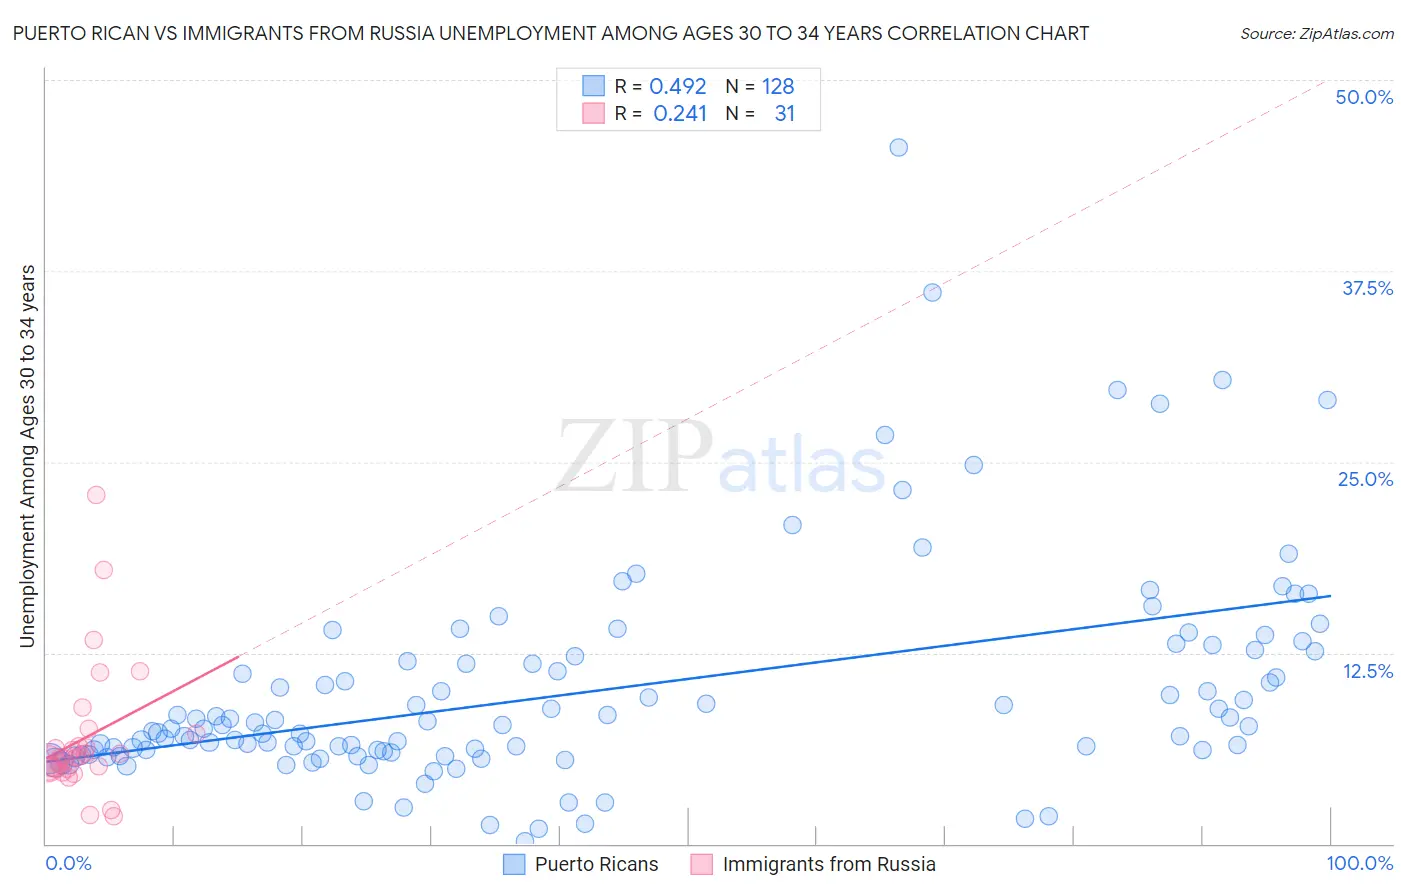
Puerto Rican vs Immigrants from Russia Unemployment Among Ages 30 to 34 years Correlation Chart
The statistical analysis conducted on geographies consisting of 479,130,196 people shows a moderate positive correlation between the proportion of Puerto Ricans and unemployment rate among population between the ages 30 and 34 in the United States with a correlation coefficient (R) of 0.492 and weighted average of 8.9%. Similarly, the statistical analysis conducted on geographies consisting of 329,311,321 people shows a weak positive correlation between the proportion of Immigrants from Russia and unemployment rate among population between the ages 30 and 34 in the United States with a correlation coefficient (R) of 0.241 and weighted average of 5.4%, a difference of 65.1%.
Unemployment Among Ages 30 to 34 years Correlation Summary
| Measurement | Puerto Rican | Immigrants from Russia |
| Minimum | 0.20% | 1.8% |
| Maximum | 45.6% | 22.8% |
| Range | 45.4% | 21.0% |
| Mean | 10.0% | 6.9% |
| Median | 7.6% | 5.7% |
| Interquartile 25% (IQ1) | 6.0% | 4.9% |
| Interquartile 75% (IQ3) | 12.1% | 7.2% |
| Interquartile Range (IQR) | 6.1% | 2.3% |
| Standard Deviation (Sample) | 7.2% | 4.4% |
| Standard Deviation (Population) | 7.1% | 4.3% |
Similar Demographics by Unemployment Among Ages 30 to 34 years
Demographics Similar to Puerto Ricans by Unemployment Among Ages 30 to 34 years
In terms of unemployment among ages 30 to 34 years, the demographic groups most similar to Puerto Ricans are Colville (9.0%, a difference of 1.9%), Alaska Native (8.5%, a difference of 4.5%), Pueblo (8.3%, a difference of 7.3%), Native/Alaskan (8.2%, a difference of 7.8%), and Pima (9.6%, a difference of 8.7%).
| Demographics | Rating | Rank | Unemployment Among Ages 30 to 34 years |
| Chippewa | 0.0 /100 | #328 | Tragic 7.8% |
| Cheyenne | 0.0 /100 | #329 | Tragic 7.8% |
| Shoshone | 0.0 /100 | #330 | Tragic 7.9% |
| Sioux | 0.0 /100 | #331 | Tragic 8.0% |
| Natives/Alaskans | 0.0 /100 | #332 | Tragic 8.2% |
| Pueblo | 0.0 /100 | #333 | Tragic 8.3% |
| Alaska Natives | 0.0 /100 | #334 | Tragic 8.5% |
| Puerto Ricans | 0.0 /100 | #335 | Tragic 8.9% |
| Colville | 0.0 /100 | #336 | Tragic 9.0% |
| Pima | 0.0 /100 | #337 | Tragic 9.6% |
| Yakama | 0.0 /100 | #338 | Tragic 9.8% |
| Tohono O'odham | 0.0 /100 | #339 | Tragic 9.8% |
| Crow | 0.0 /100 | #340 | Tragic 10.3% |
| Navajo | 0.0 /100 | #341 | Tragic 10.6% |
| Yuman | 0.0 /100 | #342 | Tragic 10.6% |
Demographics Similar to Immigrants from Russia by Unemployment Among Ages 30 to 34 years
In terms of unemployment among ages 30 to 34 years, the demographic groups most similar to Immigrants from Russia are Russian (5.4%, a difference of 0.020%), Syrian (5.4%, a difference of 0.060%), Celtic (5.4%, a difference of 0.060%), Immigrants from Greece (5.4%, a difference of 0.090%), and Immigrants from Europe (5.4%, a difference of 0.10%).
| Demographics | Rating | Rank | Unemployment Among Ages 30 to 34 years |
| Immigrants | Canada | 74.6 /100 | #137 | Good 5.4% |
| Serbians | 72.9 /100 | #138 | Good 5.4% |
| Lithuanians | 72.4 /100 | #139 | Good 5.4% |
| Immigrants | North America | 72.2 /100 | #140 | Good 5.4% |
| Immigrants | Europe | 72.1 /100 | #141 | Good 5.4% |
| Immigrants | Greece | 72.0 /100 | #142 | Good 5.4% |
| Russians | 71.1 /100 | #143 | Good 5.4% |
| Immigrants | Russia | 71.0 /100 | #144 | Good 5.4% |
| Syrians | 70.3 /100 | #145 | Good 5.4% |
| Celtics | 70.2 /100 | #146 | Good 5.4% |
| Ukrainians | 69.2 /100 | #147 | Good 5.4% |
| Immigrants | Iran | 69.1 /100 | #148 | Good 5.4% |
| Immigrants | Colombia | 68.9 /100 | #149 | Good 5.4% |
| Colombians | 68.7 /100 | #150 | Good 5.4% |
| Immigrants | Oceania | 68.1 /100 | #151 | Good 5.4% |