Puerto Rican vs Dutch Unemployment Among Ages 30 to 34 years
COMPARE
Puerto Rican
Dutch
Unemployment Among Ages 30 to 34 years
Unemployment Among Ages 30 to 34 years Comparison
Puerto Ricans
Dutch
8.9%
UNEMPLOYMENT AMONG AGES 30 TO 34 YEARS
0.0/ 100
METRIC RATING
335th/ 347
METRIC RANK
5.5%
UNEMPLOYMENT AMONG AGES 30 TO 34 YEARS
52.6/ 100
METRIC RATING
170th/ 347
METRIC RANK
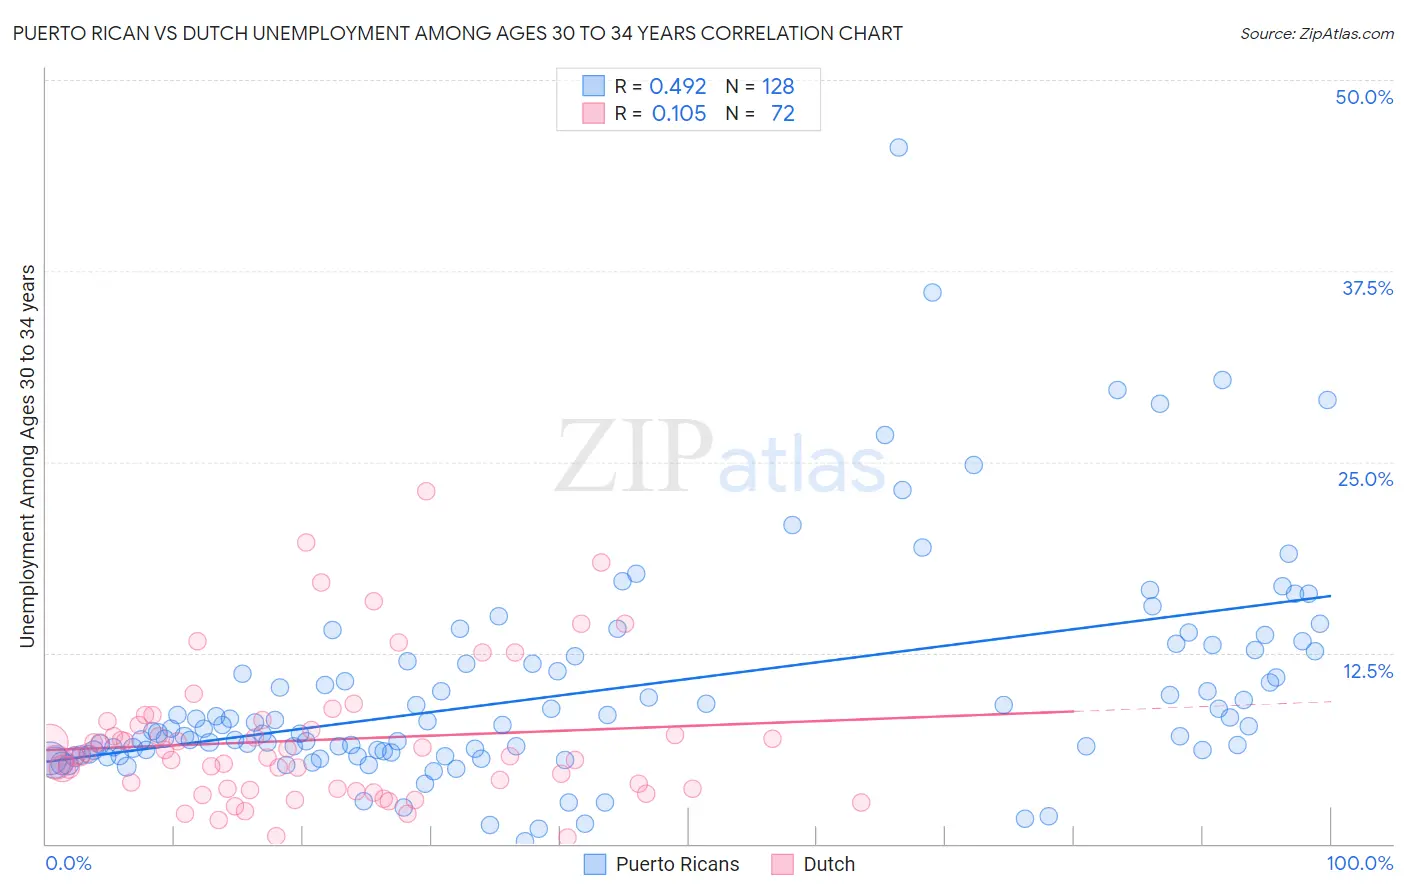
Puerto Rican vs Dutch Unemployment Among Ages 30 to 34 years Correlation Chart
The statistical analysis conducted on geographies consisting of 479,130,196 people shows a moderate positive correlation between the proportion of Puerto Ricans and unemployment rate among population between the ages 30 and 34 in the United States with a correlation coefficient (R) of 0.492 and weighted average of 8.9%. Similarly, the statistical analysis conducted on geographies consisting of 486,869,178 people shows a poor positive correlation between the proportion of Dutch and unemployment rate among population between the ages 30 and 34 in the United States with a correlation coefficient (R) of 0.105 and weighted average of 5.5%, a difference of 62.8%.
Unemployment Among Ages 30 to 34 years Correlation Summary
| Measurement | Puerto Rican | Dutch |
| Minimum | 0.20% | 0.41% |
| Maximum | 45.6% | 23.1% |
| Range | 45.4% | 22.7% |
| Mean | 10.0% | 6.8% |
| Median | 7.6% | 5.7% |
| Interquartile 25% (IQ1) | 6.0% | 3.6% |
| Interquartile 75% (IQ3) | 12.1% | 7.9% |
| Interquartile Range (IQR) | 6.1% | 4.3% |
| Standard Deviation (Sample) | 7.2% | 4.5% |
| Standard Deviation (Population) | 7.1% | 4.5% |
Similar Demographics by Unemployment Among Ages 30 to 34 years
Demographics Similar to Puerto Ricans by Unemployment Among Ages 30 to 34 years
In terms of unemployment among ages 30 to 34 years, the demographic groups most similar to Puerto Ricans are Colville (9.0%, a difference of 1.9%), Alaska Native (8.5%, a difference of 4.5%), Pueblo (8.3%, a difference of 7.3%), Native/Alaskan (8.2%, a difference of 7.8%), and Pima (9.6%, a difference of 8.7%).
| Demographics | Rating | Rank | Unemployment Among Ages 30 to 34 years |
| Chippewa | 0.0 /100 | #328 | Tragic 7.8% |
| Cheyenne | 0.0 /100 | #329 | Tragic 7.8% |
| Shoshone | 0.0 /100 | #330 | Tragic 7.9% |
| Sioux | 0.0 /100 | #331 | Tragic 8.0% |
| Natives/Alaskans | 0.0 /100 | #332 | Tragic 8.2% |
| Pueblo | 0.0 /100 | #333 | Tragic 8.3% |
| Alaska Natives | 0.0 /100 | #334 | Tragic 8.5% |
| Puerto Ricans | 0.0 /100 | #335 | Tragic 8.9% |
| Colville | 0.0 /100 | #336 | Tragic 9.0% |
| Pima | 0.0 /100 | #337 | Tragic 9.6% |
| Yakama | 0.0 /100 | #338 | Tragic 9.8% |
| Tohono O'odham | 0.0 /100 | #339 | Tragic 9.8% |
| Crow | 0.0 /100 | #340 | Tragic 10.3% |
| Navajo | 0.0 /100 | #341 | Tragic 10.6% |
| Yuman | 0.0 /100 | #342 | Tragic 10.6% |
Demographics Similar to Dutch by Unemployment Among Ages 30 to 34 years
In terms of unemployment among ages 30 to 34 years, the demographic groups most similar to Dutch are South American (5.4%, a difference of 0.020%), Immigrants from Israel (5.4%, a difference of 0.020%), Scottish (5.5%, a difference of 0.060%), Immigrants from Austria (5.5%, a difference of 0.090%), and English (5.4%, a difference of 0.15%).
| Demographics | Rating | Rank | Unemployment Among Ages 30 to 34 years |
| Arabs | 57.7 /100 | #163 | Average 5.4% |
| Basques | 57.3 /100 | #164 | Average 5.4% |
| Welsh | 56.3 /100 | #165 | Average 5.4% |
| Immigrants | Thailand | 55.6 /100 | #166 | Average 5.4% |
| English | 54.8 /100 | #167 | Average 5.4% |
| South Americans | 52.9 /100 | #168 | Average 5.4% |
| Immigrants | Israel | 52.9 /100 | #169 | Average 5.4% |
| Dutch | 52.6 /100 | #170 | Average 5.5% |
| Scottish | 51.8 /100 | #171 | Average 5.5% |
| Immigrants | Austria | 51.3 /100 | #172 | Average 5.5% |
| Peruvians | 50.2 /100 | #173 | Average 5.5% |
| Immigrants | Laos | 50.0 /100 | #174 | Average 5.5% |
| Afghans | 49.6 /100 | #175 | Average 5.5% |
| Immigrants | Peru | 48.0 /100 | #176 | Average 5.5% |
| Immigrants | Ukraine | 47.7 /100 | #177 | Average 5.5% |