Menominee vs Immigrants from Russia Unemployment Among Ages 30 to 34 years
COMPARE
Menominee
Immigrants from Russia
Unemployment Among Ages 30 to 34 years
Unemployment Among Ages 30 to 34 years Comparison
Menominee
Immigrants from Russia
6.4%
UNEMPLOYMENT AMONG AGES 30 TO 34 YEARS
0.0/ 100
METRIC RATING
289th/ 347
METRIC RANK
5.4%
UNEMPLOYMENT AMONG AGES 30 TO 34 YEARS
71.0/ 100
METRIC RATING
144th/ 347
METRIC RANK
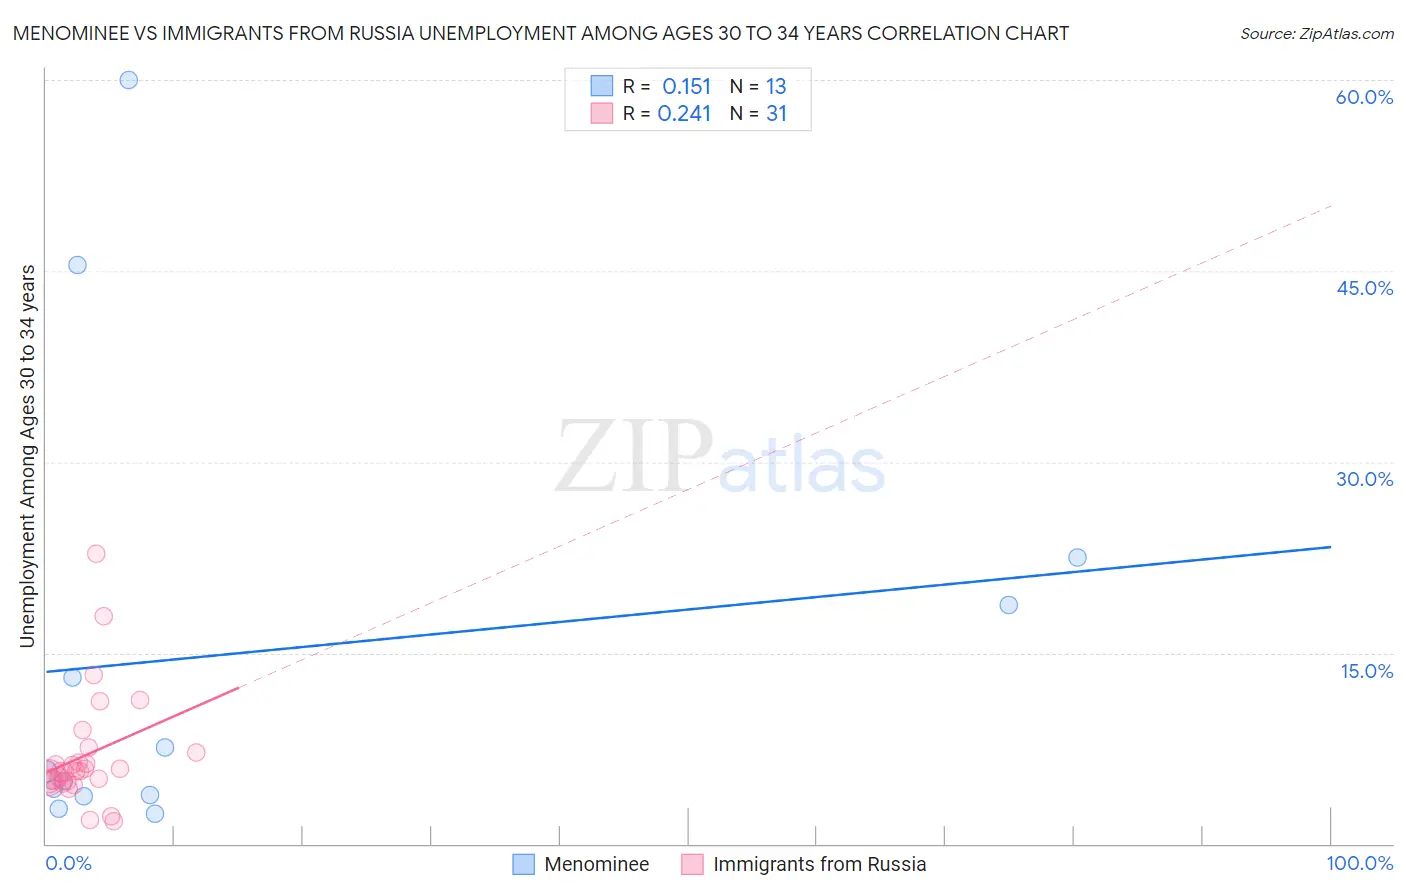
Menominee vs Immigrants from Russia Unemployment Among Ages 30 to 34 years Correlation Chart
The statistical analysis conducted on geographies consisting of 44,912,548 people shows a poor positive correlation between the proportion of Menominee and unemployment rate among population between the ages 30 and 34 in the United States with a correlation coefficient (R) of 0.151 and weighted average of 6.4%. Similarly, the statistical analysis conducted on geographies consisting of 329,311,321 people shows a weak positive correlation between the proportion of Immigrants from Russia and unemployment rate among population between the ages 30 and 34 in the United States with a correlation coefficient (R) of 0.241 and weighted average of 5.4%, a difference of 19.7%.
Unemployment Among Ages 30 to 34 years Correlation Summary
| Measurement | Menominee | Immigrants from Russia |
| Minimum | 2.4% | 1.8% |
| Maximum | 60.0% | 22.8% |
| Range | 57.6% | 21.0% |
| Mean | 15.0% | 6.9% |
| Median | 5.7% | 5.7% |
| Interquartile 25% (IQ1) | 3.7% | 4.9% |
| Interquartile 75% (IQ3) | 20.6% | 7.2% |
| Interquartile Range (IQR) | 16.9% | 2.3% |
| Standard Deviation (Sample) | 18.1% | 4.4% |
| Standard Deviation (Population) | 17.4% | 4.3% |
Similar Demographics by Unemployment Among Ages 30 to 34 years
Demographics Similar to Menominee by Unemployment Among Ages 30 to 34 years
In terms of unemployment among ages 30 to 34 years, the demographic groups most similar to Menominee are Senegalese (6.4%, a difference of 0.040%), Immigrants from West Indies (6.4%, a difference of 0.080%), Central American Indian (6.4%, a difference of 0.10%), Choctaw (6.4%, a difference of 0.14%), and Immigrants from Bangladesh (6.4%, a difference of 0.25%).
| Demographics | Rating | Rank | Unemployment Among Ages 30 to 34 years |
| Africans | 0.0 /100 | #282 | Tragic 6.4% |
| Hispanics or Latinos | 0.0 /100 | #283 | Tragic 6.4% |
| Immigrants | Bangladesh | 0.0 /100 | #284 | Tragic 6.4% |
| Choctaw | 0.0 /100 | #285 | Tragic 6.4% |
| Central American Indians | 0.0 /100 | #286 | Tragic 6.4% |
| Immigrants | West Indies | 0.0 /100 | #287 | Tragic 6.4% |
| Senegalese | 0.0 /100 | #288 | Tragic 6.4% |
| Menominee | 0.0 /100 | #289 | Tragic 6.4% |
| Immigrants | Trinidad and Tobago | 0.0 /100 | #290 | Tragic 6.5% |
| Jamaicans | 0.0 /100 | #291 | Tragic 6.5% |
| Vietnamese | 0.0 /100 | #292 | Tragic 6.5% |
| West Indians | 0.0 /100 | #293 | Tragic 6.5% |
| Barbadians | 0.0 /100 | #294 | Tragic 6.5% |
| Trinidadians and Tobagonians | 0.0 /100 | #295 | Tragic 6.5% |
| Immigrants | Jamaica | 0.0 /100 | #296 | Tragic 6.5% |
Demographics Similar to Immigrants from Russia by Unemployment Among Ages 30 to 34 years
In terms of unemployment among ages 30 to 34 years, the demographic groups most similar to Immigrants from Russia are Russian (5.4%, a difference of 0.020%), Syrian (5.4%, a difference of 0.060%), Celtic (5.4%, a difference of 0.060%), Immigrants from Greece (5.4%, a difference of 0.090%), and Immigrants from Europe (5.4%, a difference of 0.10%).
| Demographics | Rating | Rank | Unemployment Among Ages 30 to 34 years |
| Immigrants | Canada | 74.6 /100 | #137 | Good 5.4% |
| Serbians | 72.9 /100 | #138 | Good 5.4% |
| Lithuanians | 72.4 /100 | #139 | Good 5.4% |
| Immigrants | North America | 72.2 /100 | #140 | Good 5.4% |
| Immigrants | Europe | 72.1 /100 | #141 | Good 5.4% |
| Immigrants | Greece | 72.0 /100 | #142 | Good 5.4% |
| Russians | 71.1 /100 | #143 | Good 5.4% |
| Immigrants | Russia | 71.0 /100 | #144 | Good 5.4% |
| Syrians | 70.3 /100 | #145 | Good 5.4% |
| Celtics | 70.2 /100 | #146 | Good 5.4% |
| Ukrainians | 69.2 /100 | #147 | Good 5.4% |
| Immigrants | Iran | 69.1 /100 | #148 | Good 5.4% |
| Immigrants | Colombia | 68.9 /100 | #149 | Good 5.4% |
| Colombians | 68.7 /100 | #150 | Good 5.4% |
| Immigrants | Oceania | 68.1 /100 | #151 | Good 5.4% |