Immigrants from Ukraine vs Immigrants from Russia Unemployment Among Ages 30 to 34 years

COMPARE

Immigrants from Ukraine
Race
Ancestry
AfghanAfricanAlaska NativeAlaskan AthabascanAlbanianAleutAlsatianAmericanApacheArabArapahoArgentineanArmenianAssyrian/Chaldean/SyriacAustralianAustrianBahamianBangladeshiBarbadianBasqueBelgianBelizeanBermudanBhutaneseBlackfeetBolivianBrazilianBritishBritish West IndianBulgarianBurmeseCajunCambodianCanadianCape VerdeanCarpatho RusynCelticCentral AmericanCentral American IndianCherokeeCheyenneChickasawChileanChineseChippewaChoctawColombianColvilleComancheCosta RicanCreeCreekCroatianCrowCubanCypriotCzechCzechoslovakianDanishDelawareDominicanDutchDutch West IndianEastern EuropeanEcuadorianEgyptianEnglishEstonianEthiopianEuropeanFijianFilipinoFinnishFrenchFrench American IndianFrench CanadianGermanGerman RussianGhanaianGreekGuamanian/ChamorroGuatemalanGuyaneseHaitianHmongHonduranHopiHoumaHungarianIcelanderIndian (Asian)IndonesianInupiatIranianIraqiIrishIroquoisIsraeliItalianJamaicanJapaneseJordanianKenyanKiowaKoreanLaotianLatvianLebaneseLiberianLithuanianLumbeeLuxembourgerMacedonianMalaysianMalteseMarshalleseMenomineeMexicanMexican American IndianMongolianMoroccanNative HawaiianNavajoNepaleseNew ZealanderNicaraguanNigerianNorthern EuropeanNorwegianOkinawanOsageOttawaPaiutePakistaniPalestinianPanamanianParaguayanPennsylvania GermanPeruvianPimaPolishPortuguesePotawatomiPuebloPuerto RicanPuget Sound SalishRomanianRussianSalvadoranSamoanScandinavianScotch-IrishScottishSeminoleSenegaleseSerbianShoshoneSierra LeoneanSiouxSlavicSlovakSloveneSomaliSouth AfricanSouth AmericanSouth American IndianSoviet UnionSpaniardSpanishSpanish AmericanSpanish American IndianSri LankanSubsaharan AfricanSudaneseSwedishSwissSyrianTaiwaneseThaiTlingit-HaidaTohono O'OdhamTonganTrinidadian and TobagonianTsimshianTurkishU.S. Virgin IslanderUgandanUkrainianUruguayanUteVenezuelanVietnameseWelshWest IndianYakamaYaquiYugoslavianYumanYup'ikZimbabwean
Immigration
NonimmigrantsImmigrantsAfghanistanAfricaAlbaniaArgentinaArmeniaAsiaAustraliaAustriaBahamasBangladeshBarbadosBelarusBelgiumBelizeBoliviaBosnia and HerzegovinaBrazilBulgariaBurma/MyanmarCabo VerdeCambodiaCameroonCanadaCaribbeanCentral AmericaChileChinaColombiaCongoCosta RicaCroatiaCubaCzechoslovakiaDenmarkDominicaDominican RepublicEastern AfricaEastern AsiaEastern EuropeEcuadorEgyptEl SalvadorEnglandEritreaEthiopiaEuropeFijiFranceGermanyGhanaGreeceGrenadaGuatemalaGuyanaHaitiHondurasHong KongHungaryIndiaIndonesiaIranIraqIrelandIsraelItalyJamaicaJapanJordanKazakhstanKenyaKoreaKuwaitLaosLatin AmericaLatviaLebanonLiberiaLithuaniaMalaysiaMexicoMicronesiaMiddle AfricaMoldovaMoroccoNepalNetherlandsNicaraguaNigeriaNorth AmericaNorth MacedoniaNorthern AfricaNorthern EuropeNorwayOceaniaPakistanPanamaPeruPhilippinesPolandPortugalRomaniaSaudi ArabiaScotlandSenegalSerbiaSierra LeoneSingaporeSomaliaSouth AfricaSouth AmericaSouth Central AsiaSouth Eastern AsiaSouthern EuropeSpainSri LankaSt. Vincent and the GrenadinesSudanSwedenSwitzerlandSyriaTaiwanThailandTrinidad and TobagoTurkeyUgandaUkraineUruguayUzbekistanVenezuelaVietnamWest IndiesWestern AfricaWestern AsiaWestern EuropeYemenZaireZimbabweAzores
Immigrants from Russia
Race
Ancestry
AfghanAfricanAlaska NativeAlaskan AthabascanAlbanianAleutAlsatianAmericanApacheArabArapahoArgentineanArmenianAssyrian/Chaldean/SyriacAustralianAustrianBahamianBangladeshiBarbadianBasqueBelgianBelizeanBermudanBhutaneseBlackfeetBolivianBrazilianBritishBritish West IndianBulgarianBurmeseCajunCambodianCanadianCape VerdeanCarpatho RusynCelticCentral AmericanCentral American IndianCherokeeCheyenneChickasawChileanChineseChippewaChoctawColombianColvilleComancheCosta RicanCreeCreekCroatianCrowCubanCypriotCzechCzechoslovakianDanishDelawareDominicanDutchDutch West IndianEastern EuropeanEcuadorianEgyptianEnglishEstonianEthiopianEuropeanFijianFilipinoFinnishFrenchFrench American IndianFrench CanadianGermanGerman RussianGhanaianGreekGuamanian/ChamorroGuatemalanGuyaneseHaitianHmongHonduranHopiHoumaHungarianIcelanderIndian (Asian)IndonesianInupiatIranianIraqiIrishIroquoisIsraeliItalianJamaicanJapaneseJordanianKenyanKiowaKoreanLaotianLatvianLebaneseLiberianLithuanianLumbeeLuxembourgerMacedonianMalaysianMalteseMarshalleseMenomineeMexicanMexican American IndianMongolianMoroccanNative HawaiianNavajoNepaleseNew ZealanderNicaraguanNigerianNorthern EuropeanNorwegianOkinawanOsageOttawaPaiutePakistaniPalestinianPanamanianParaguayanPennsylvania GermanPeruvianPimaPolishPortuguesePotawatomiPuebloPuerto RicanPuget Sound SalishRomanianRussianSalvadoranSamoanScandinavianScotch-IrishScottishSeminoleSenegaleseSerbianShoshoneSierra LeoneanSiouxSlavicSlovakSloveneSomaliSouth AfricanSouth AmericanSouth American IndianSoviet UnionSpaniardSpanishSpanish AmericanSpanish American IndianSri LankanSubsaharan AfricanSudaneseSwedishSwissSyrianTaiwaneseThaiTlingit-HaidaTohono O'OdhamTonganTrinidadian and TobagonianTsimshianTurkishU.S. Virgin IslanderUgandanUkrainianUruguayanUteVenezuelanVietnameseWelshWest IndianYakamaYaquiYugoslavianYumanYup'ikZimbabwean
Immigration
NonimmigrantsImmigrantsAfghanistanAfricaAlbaniaArgentinaArmeniaAsiaAustraliaAustriaBahamasBangladeshBarbadosBelarusBelgiumBelizeBoliviaBosnia and HerzegovinaBrazilBulgariaBurma/MyanmarCabo VerdeCambodiaCameroonCanadaCaribbeanCentral AmericaChileChinaColombiaCongoCosta RicaCroatiaCubaCzechoslovakiaDenmarkDominicaDominican RepublicEastern AfricaEastern AsiaEastern EuropeEcuadorEgyptEl SalvadorEnglandEritreaEthiopiaEuropeFijiFranceGermanyGhanaGreeceGrenadaGuatemalaGuyanaHaitiHondurasHong KongHungaryIndiaIndonesiaIranIraqIrelandIsraelItalyJamaicaJapanJordanKazakhstanKenyaKoreaKuwaitLaosLatin AmericaLatviaLebanonLiberiaLithuaniaMalaysiaMexicoMicronesiaMiddle AfricaMoldovaMoroccoNepalNetherlandsNicaraguaNigeriaNorth AmericaNorth MacedoniaNorthern AfricaNorthern EuropeNorwayOceaniaPakistanPanamaPeruPhilippinesPolandPortugalRomaniaRussiaSaudi ArabiaScotlandSenegalSerbiaSierra LeoneSingaporeSomaliaSouth AfricaSouth AmericaSouth Central AsiaSouth Eastern AsiaSouthern EuropeSpainSri LankaSt. Vincent and the GrenadinesSudanSwedenSwitzerlandSyriaTaiwanThailandTrinidad and TobagoTurkeyUgandaUruguayUzbekistanVenezuelaVietnamWest IndiesWestern AfricaWestern AsiaWestern EuropeYemenZaireZimbabweAzores
Unemployment Among Ages 30 to 34 years
Income
Poverty
Unemployment
Labor Participation
Family Structure
Vehicle Availability
Education Level
Disability

Unemployment Among Ages 30 to 34 years Comparison

Immigrants from Ukraine

Immigrants from Russia

Average
Good
5.5%
UNEMPLOYMENT AMONG AGES 30 TO 34 YEARS
47.7/ 100
METRIC RATING
177th/ 347
METRIC RANK
5.4%
UNEMPLOYMENT AMONG AGES 30 TO 34 YEARS
71.0/ 100
METRIC RATING
144th/ 347
METRIC RANK

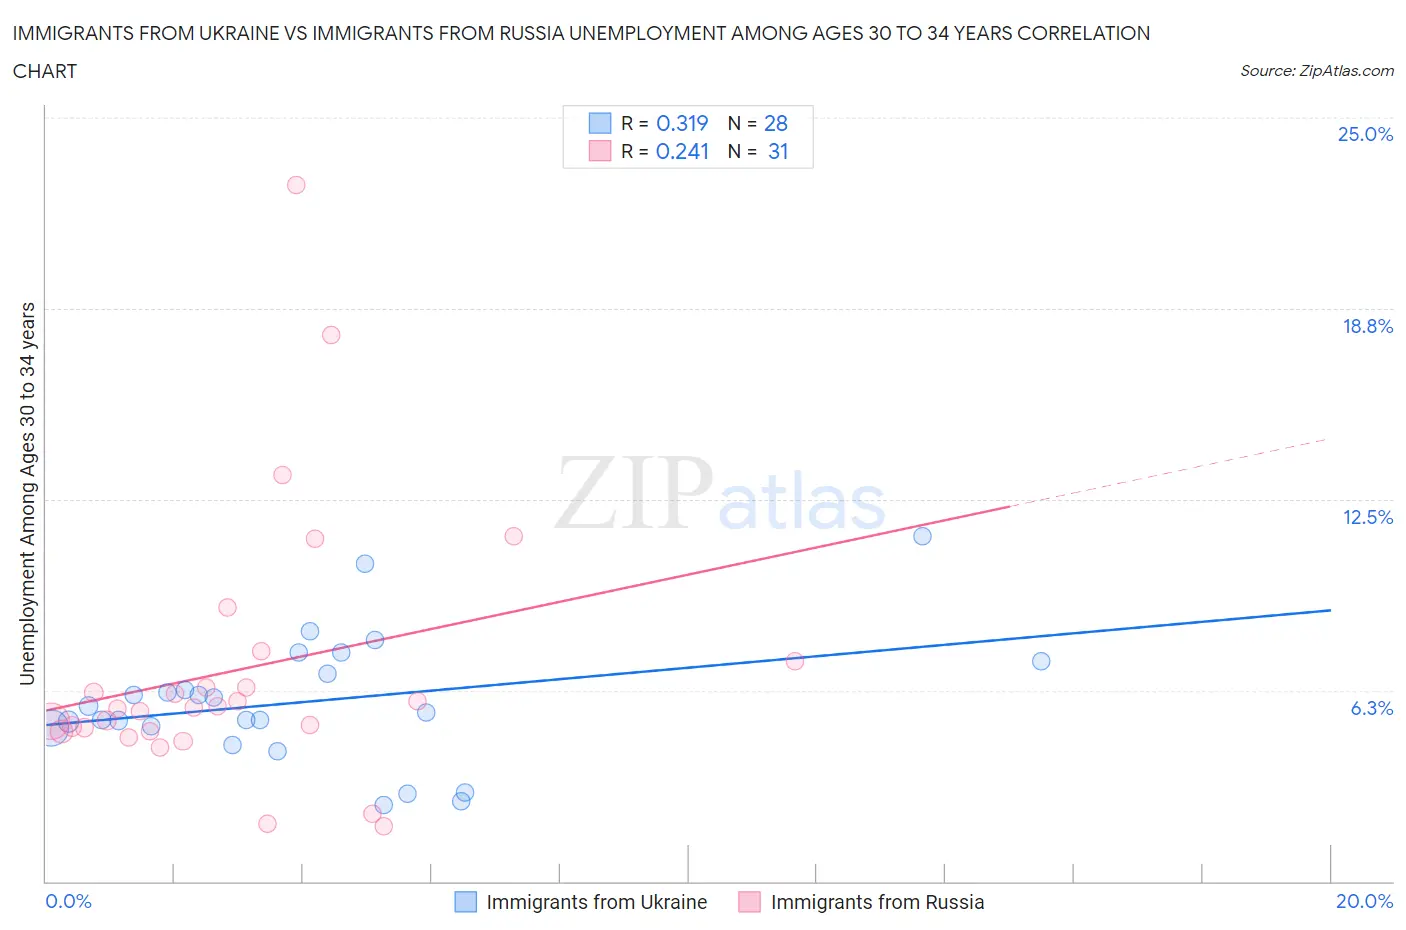
Immigrants from Ukraine vs Immigrants from Russia Unemployment Among Ages 30 to 34 years Correlation Chart

The statistical analysis conducted on geographies consisting of 276,715,572 people shows a mild positive correlation between the proportion of Immigrants from Ukraine and unemployment rate among population between the ages 30 and 34 in the United States with a correlation coefficient (R) of 0.319 and weighted average of 5.5%. Similarly, the statistical analysis conducted on geographies consisting of 329,311,321 people shows a weak positive correlation between the proportion of Immigrants from Russia and unemployment rate among population between the ages 30 and 34 in the United States with a correlation coefficient (R) of 0.241 and weighted average of 5.4%, a difference of 1.7%.
Immigrants from Ukraine vs Immigrants from Russia Unemployment Among Ages 30 to 34 years

Unemployment Among Ages 30 to 34 years Correlation Summary

MeasurementImmigrants from UkraineImmigrants from Russia
Minimum2.5%1.8%
Maximum11.3%22.8%
Range8.8%21.0%
Mean5.9%6.9%
Median5.6%5.7%
Interquartile 25% (IQ1)5.1%4.9%
Interquartile 75% (IQ3)7.0%7.2%
Interquartile Range (IQR)2.0%2.3%
Standard Deviation (Sample)2.1%4.4%
Standard Deviation (Population)2.0%4.3%

Similar Demographics by Unemployment Among Ages 30 to 34 years

Demographics Similar to Immigrants from Ukraine by Unemployment Among Ages 30 to 34 years

In terms of unemployment among ages 30 to 34 years, the demographic groups most similar to Immigrants from Ukraine are Immigrants from Peru (5.5%, a difference of 0.020%), Macedonian (5.5%, a difference of 0.050%), Costa Rican (5.5%, a difference of 0.070%), Afghan (5.5%, a difference of 0.13%), and Immigrants from Laos (5.5%, a difference of 0.16%).
DemographicsRating | RankUnemployment Among Ages 30 to 34 years
Dutch
52.6
/100
|
#170
Average
5.5%
Scottish
51.8
/100
|
#171
Average
5.5%
Immigrants | Austria
51.3
/100
|
#172
Average
5.5%
Peruvians
50.2
/100
|
#173
Average
5.5%
Immigrants | Laos
50.0
/100
|
#174
Average
5.5%
Afghans
49.6
/100
|
#175
Average
5.5%
Immigrants | Peru
48.0
/100
|
#176
Average
5.5%
Immigrants | Ukraine
47.7
/100
|
#177
Average
5.5%
Macedonians
47.1
/100
|
#178
Average
5.5%
Costa Ricans
46.7
/100
|
#179
Average
5.5%
Italians
45.5
/100
|
#180
Average
5.5%
Immigrants | Lebanon
43.5
/100
|
#181
Average
5.5%
Immigrants | Denmark
43.4
/100
|
#182
Average
5.5%
Hungarians
43.1
/100
|
#183
Average
5.5%
Malaysians
41.8
/100
|
#184
Average
5.5%

Demographics Similar to Immigrants from Russia by Unemployment Among Ages 30 to 34 years

In terms of unemployment among ages 30 to 34 years, the demographic groups most similar to Immigrants from Russia are Russian (5.4%, a difference of 0.020%), Syrian (5.4%, a difference of 0.060%), Celtic (5.4%, a difference of 0.060%), Immigrants from Greece (5.4%, a difference of 0.090%), and Immigrants from Europe (5.4%, a difference of 0.10%).
DemographicsRating | RankUnemployment Among Ages 30 to 34 years
Immigrants | Canada
74.6
/100
|
#137
Good
5.4%
Serbians
72.9
/100
|
#138
Good
5.4%
Lithuanians
72.4
/100
|
#139
Good
5.4%
Immigrants | North America
72.2
/100
|
#140
Good
5.4%
Immigrants | Europe
72.1
/100
|
#141
Good
5.4%
Immigrants | Greece
72.0
/100
|
#142
Good
5.4%
Russians
71.1
/100
|
#143
Good
5.4%
Immigrants | Russia
71.0
/100
|
#144
Good
5.4%
Syrians
70.3
/100
|
#145
Good
5.4%
Celtics
70.2
/100
|
#146
Good
5.4%
Ukrainians
69.2
/100
|
#147
Good
5.4%
Immigrants | Iran
69.1
/100
|
#148
Good
5.4%
Immigrants | Colombia
68.9
/100
|
#149
Good
5.4%
Colombians
68.7
/100
|
#150
Good
5.4%
Immigrants | Oceania
68.1
/100
|
#151
Good
5.4%