Puerto Rican vs Immigrants from Bolivia Unemployment Among Women with Children Under 18 years
COMPARE
Puerto Rican
Immigrants from Bolivia
Unemployment Among Women with Children Under 18 years
Unemployment Among Women with Children Under 18 years Comparison
Puerto Ricans
Immigrants from Bolivia
9.0%
UNEMPLOYMENT AMONG WOMEN WITH CHILDREN UNDER 18 YEARS
0.0/ 100
METRIC RATING
342nd/ 347
METRIC RANK
5.1%
UNEMPLOYMENT AMONG WOMEN WITH CHILDREN UNDER 18 YEARS
96.1/ 100
METRIC RATING
72nd/ 347
METRIC RANK
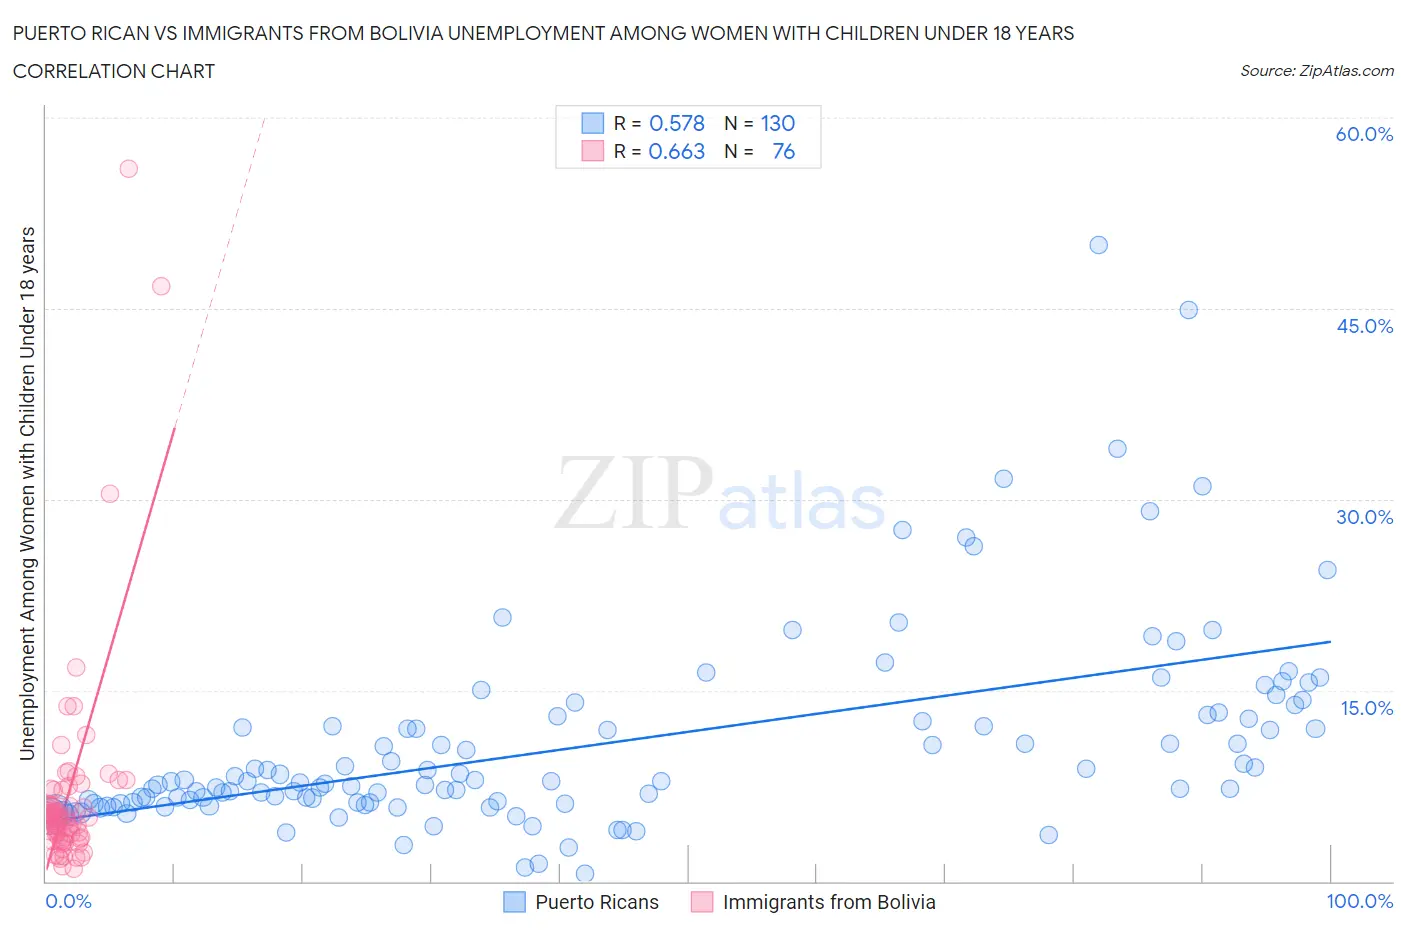
Puerto Rican vs Immigrants from Bolivia Unemployment Among Women with Children Under 18 years Correlation Chart
The statistical analysis conducted on geographies consisting of 493,093,721 people shows a substantial positive correlation between the proportion of Puerto Ricans and unemployment rate among women with children under the age of 18 in the United States with a correlation coefficient (R) of 0.578 and weighted average of 9.0%. Similarly, the statistical analysis conducted on geographies consisting of 156,676,474 people shows a significant positive correlation between the proportion of Immigrants from Bolivia and unemployment rate among women with children under the age of 18 in the United States with a correlation coefficient (R) of 0.663 and weighted average of 5.1%, a difference of 75.3%.
Unemployment Among Women with Children Under 18 years Correlation Summary
| Measurement | Puerto Rican | Immigrants from Bolivia |
| Minimum | 0.60% | 1.0% |
| Maximum | 50.0% | 56.0% |
| Range | 49.4% | 55.0% |
| Mean | 10.7% | 6.8% |
| Median | 7.8% | 5.0% |
| Interquartile 25% (IQ1) | 6.2% | 3.5% |
| Interquartile 75% (IQ3) | 12.7% | 6.6% |
| Interquartile Range (IQR) | 6.6% | 3.1% |
| Standard Deviation (Sample) | 7.9% | 8.4% |
| Standard Deviation (Population) | 7.9% | 8.4% |
Similar Demographics by Unemployment Among Women with Children Under 18 years
Demographics Similar to Puerto Ricans by Unemployment Among Women with Children Under 18 years
In terms of unemployment among women with children under 18 years, the demographic groups most similar to Puerto Ricans are Tohono O'odham (8.9%, a difference of 1.7%), Arapaho (9.2%, a difference of 2.1%), Inupiat (9.6%, a difference of 6.4%), Yuman (9.8%, a difference of 8.4%), and Crow (8.2%, a difference of 9.2%).
| Demographics | Rating | Rank | Unemployment Among Women with Children Under 18 years |
| Immigrants | Dominican Republic | 0.0 /100 | #333 | Tragic 7.5% |
| Cheyenne | 0.0 /100 | #334 | Tragic 7.8% |
| Apache | 0.0 /100 | #335 | Tragic 7.9% |
| Sioux | 0.0 /100 | #336 | Tragic 7.9% |
| Yakama | 0.0 /100 | #337 | Tragic 8.1% |
| Immigrants | Yemen | 0.0 /100 | #338 | Tragic 8.2% |
| Navajo | 0.0 /100 | #339 | Tragic 8.2% |
| Crow | 0.0 /100 | #340 | Tragic 8.2% |
| Tohono O'odham | 0.0 /100 | #341 | Tragic 8.9% |
| Puerto Ricans | 0.0 /100 | #342 | Tragic 9.0% |
| Arapaho | 0.0 /100 | #343 | Tragic 9.2% |
| Inupiat | 0.0 /100 | #344 | Tragic 9.6% |
| Yuman | 0.0 /100 | #345 | Tragic 9.8% |
| Yup'ik | 0.0 /100 | #346 | Tragic 11.0% |
| Pima | 0.0 /100 | #347 | Tragic 11.7% |
Demographics Similar to Immigrants from Bolivia by Unemployment Among Women with Children Under 18 years
In terms of unemployment among women with children under 18 years, the demographic groups most similar to Immigrants from Bolivia are Albanian (5.1%, a difference of 0.070%), Immigrants from Northern Europe (5.1%, a difference of 0.080%), Immigrants from Asia (5.1%, a difference of 0.11%), Puget Sound Salish (5.1%, a difference of 0.14%), and Zimbabwean (5.1%, a difference of 0.16%).
| Demographics | Rating | Rank | Unemployment Among Women with Children Under 18 years |
| Immigrants | Sweden | 97.1 /100 | #65 | Exceptional 5.1% |
| Immigrants | Australia | 97.0 /100 | #66 | Exceptional 5.1% |
| Fijians | 96.9 /100 | #67 | Exceptional 5.1% |
| Irish | 96.8 /100 | #68 | Exceptional 5.1% |
| Austrians | 96.6 /100 | #69 | Exceptional 5.1% |
| Icelanders | 96.6 /100 | #70 | Exceptional 5.1% |
| Serbians | 96.5 /100 | #71 | Exceptional 5.1% |
| Immigrants | Bolivia | 96.1 /100 | #72 | Exceptional 5.1% |
| Albanians | 95.9 /100 | #73 | Exceptional 5.1% |
| Immigrants | Northern Europe | 95.9 /100 | #74 | Exceptional 5.1% |
| Immigrants | Asia | 95.8 /100 | #75 | Exceptional 5.1% |
| Puget Sound Salish | 95.8 /100 | #76 | Exceptional 5.1% |
| Zimbabweans | 95.7 /100 | #77 | Exceptional 5.1% |
| Assyrians/Chaldeans/Syriacs | 95.7 /100 | #78 | Exceptional 5.1% |
| Immigrants | Croatia | 95.6 /100 | #79 | Exceptional 5.1% |