Puerto Rican vs Pima Unemployment Among Women with Children Under 18 years
COMPARE
Puerto Rican
Pima
Unemployment Among Women with Children Under 18 years
Unemployment Among Women with Children Under 18 years Comparison
Puerto Ricans
Pima
9.0%
UNEMPLOYMENT AMONG WOMEN WITH CHILDREN UNDER 18 YEARS
0.0/ 100
METRIC RATING
342nd/ 347
METRIC RANK
11.7%
UNEMPLOYMENT AMONG WOMEN WITH CHILDREN UNDER 18 YEARS
0.0/ 100
METRIC RATING
347th/ 347
METRIC RANK
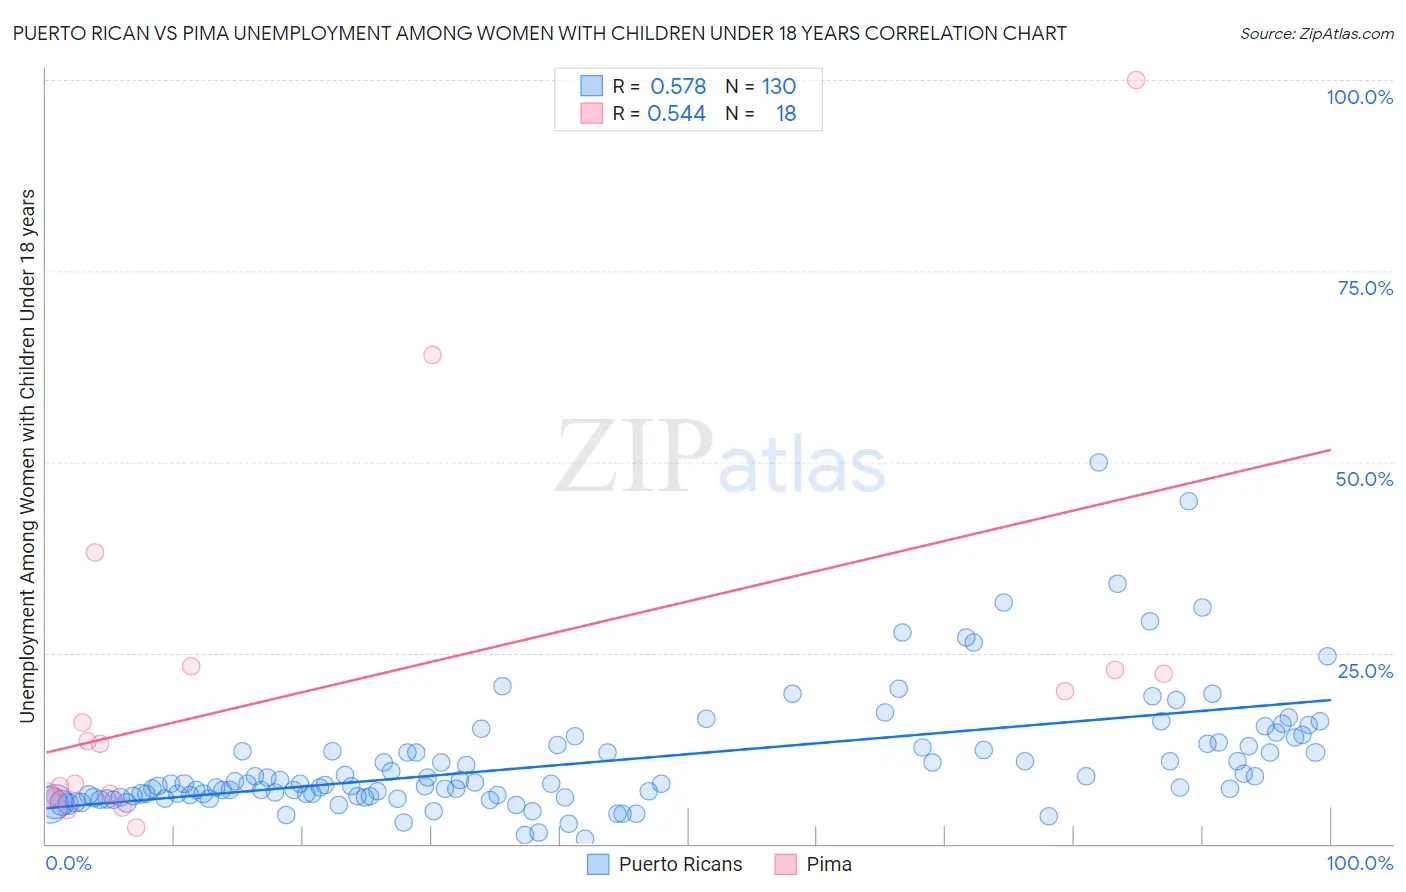
Puerto Rican vs Pima Unemployment Among Women with Children Under 18 years Correlation Chart
The statistical analysis conducted on geographies consisting of 493,093,721 people shows a substantial positive correlation between the proportion of Puerto Ricans and unemployment rate among women with children under the age of 18 in the United States with a correlation coefficient (R) of 0.578 and weighted average of 9.0%. Similarly, the statistical analysis conducted on geographies consisting of 60,829,191 people shows a substantial positive correlation between the proportion of Pima and unemployment rate among women with children under the age of 18 in the United States with a correlation coefficient (R) of 0.544 and weighted average of 11.7%, a difference of 29.8%.
Unemployment Among Women with Children Under 18 years Correlation Summary
| Measurement | Puerto Rican | Pima |
| Minimum | 0.60% | 2.2% |
| Maximum | 50.0% | 100.0% |
| Range | 49.4% | 97.8% |
| Mean | 10.7% | 21.0% |
| Median | 7.8% | 13.2% |
| Interquartile 25% (IQ1) | 6.2% | 6.3% |
| Interquartile 75% (IQ3) | 12.7% | 22.8% |
| Interquartile Range (IQR) | 6.6% | 16.5% |
| Standard Deviation (Sample) | 7.9% | 24.8% |
| Standard Deviation (Population) | 7.9% | 24.1% |
Demographics Similar to Puerto Ricans and Pima by Unemployment Among Women with Children Under 18 years
In terms of unemployment among women with children under 18 years, the demographic groups most similar to Puerto Ricans are Tohono O'odham (8.9%, a difference of 1.7%), Arapaho (9.2%, a difference of 2.1%), Inupiat (9.6%, a difference of 6.4%), Yuman (9.8%, a difference of 8.4%), and Crow (8.2%, a difference of 9.2%). Similarly, the demographic groups most similar to Pima are Yup'ik (11.0%, a difference of 6.0%), Yuman (9.8%, a difference of 19.7%), Inupiat (9.6%, a difference of 22.0%), Arapaho (9.2%, a difference of 27.1%), and Tohono O'odham (8.9%, a difference of 32.0%).
| Demographics | Rating | Rank | Unemployment Among Women with Children Under 18 years |
| Natives/Alaskans | 0.0 /100 | #328 | Tragic 7.2% |
| Blacks/African Americans | 0.0 /100 | #329 | Tragic 7.3% |
| Colville | 0.0 /100 | #330 | Tragic 7.4% |
| Hopi | 0.0 /100 | #331 | Tragic 7.4% |
| Dominicans | 0.0 /100 | #332 | Tragic 7.5% |
| Immigrants | Dominican Republic | 0.0 /100 | #333 | Tragic 7.5% |
| Cheyenne | 0.0 /100 | #334 | Tragic 7.8% |
| Apache | 0.0 /100 | #335 | Tragic 7.9% |
| Sioux | 0.0 /100 | #336 | Tragic 7.9% |
| Yakama | 0.0 /100 | #337 | Tragic 8.1% |
| Immigrants | Yemen | 0.0 /100 | #338 | Tragic 8.2% |
| Navajo | 0.0 /100 | #339 | Tragic 8.2% |
| Crow | 0.0 /100 | #340 | Tragic 8.2% |
| Tohono O'odham | 0.0 /100 | #341 | Tragic 8.9% |
| Puerto Ricans | 0.0 /100 | #342 | Tragic 9.0% |
| Arapaho | 0.0 /100 | #343 | Tragic 9.2% |
| Inupiat | 0.0 /100 | #344 | Tragic 9.6% |
| Yuman | 0.0 /100 | #345 | Tragic 9.8% |
| Yup'ik | 0.0 /100 | #346 | Tragic 11.0% |
| Pima | 0.0 /100 | #347 | Tragic 11.7% |