Puerto Rican vs Black/African American Unemployment Among Women with Children Under 18 years
COMPARE
Puerto Rican
Black/African American
Unemployment Among Women with Children Under 18 years
Unemployment Among Women with Children Under 18 years Comparison
Puerto Ricans
Blacks/African Americans
9.0%
UNEMPLOYMENT AMONG WOMEN WITH CHILDREN UNDER 18 YEARS
0.0/ 100
METRIC RATING
342nd/ 347
METRIC RANK
7.3%
UNEMPLOYMENT AMONG WOMEN WITH CHILDREN UNDER 18 YEARS
0.0/ 100
METRIC RATING
329th/ 347
METRIC RANK
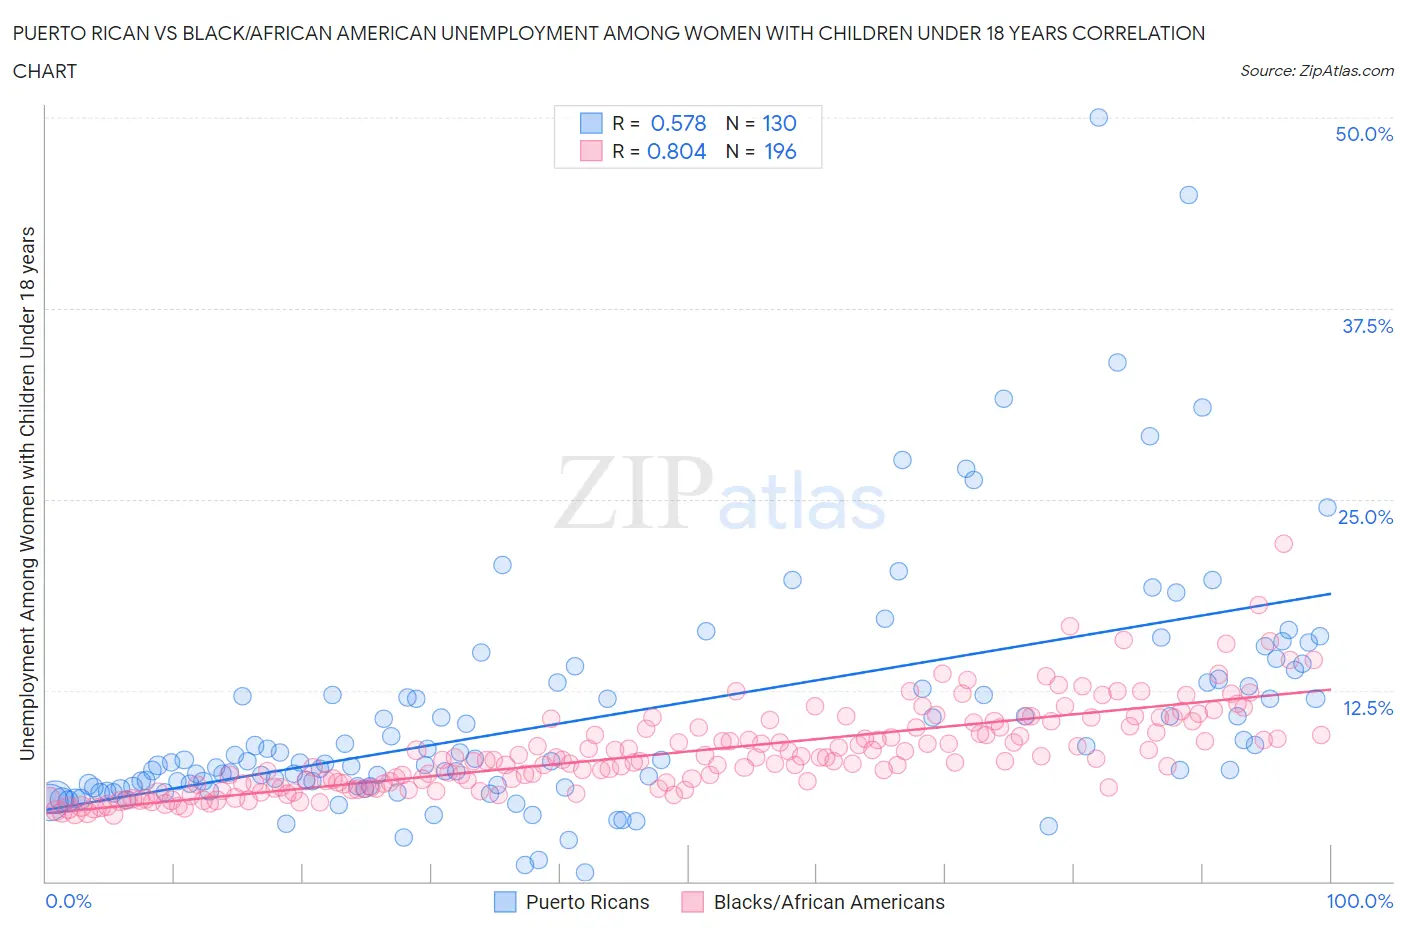
Puerto Rican vs Black/African American Unemployment Among Women with Children Under 18 years Correlation Chart
The statistical analysis conducted on geographies consisting of 493,093,721 people shows a substantial positive correlation between the proportion of Puerto Ricans and unemployment rate among women with children under the age of 18 in the United States with a correlation coefficient (R) of 0.578 and weighted average of 9.0%. Similarly, the statistical analysis conducted on geographies consisting of 516,708,014 people shows a very strong positive correlation between the proportion of Blacks/African Americans and unemployment rate among women with children under the age of 18 in the United States with a correlation coefficient (R) of 0.804 and weighted average of 7.3%, a difference of 23.7%.
Unemployment Among Women with Children Under 18 years Correlation Summary
| Measurement | Puerto Rican | Black/African American |
| Minimum | 0.60% | 4.4% |
| Maximum | 50.0% | 22.1% |
| Range | 49.4% | 17.7% |
| Mean | 10.7% | 8.4% |
| Median | 7.8% | 7.9% |
| Interquartile 25% (IQ1) | 6.2% | 6.2% |
| Interquartile 75% (IQ3) | 12.7% | 10.1% |
| Interquartile Range (IQR) | 6.6% | 3.9% |
| Standard Deviation (Sample) | 7.9% | 2.9% |
| Standard Deviation (Population) | 7.9% | 2.9% |
Demographics Similar to Puerto Ricans and Blacks/African Americans by Unemployment Among Women with Children Under 18 years
In terms of unemployment among women with children under 18 years, the demographic groups most similar to Puerto Ricans are Tohono O'odham (8.9%, a difference of 1.7%), Arapaho (9.2%, a difference of 2.1%), Inupiat (9.6%, a difference of 6.4%), Yuman (9.8%, a difference of 8.4%), and Crow (8.2%, a difference of 9.2%). Similarly, the demographic groups most similar to Blacks/African Americans are Native/Alaskan (7.2%, a difference of 0.41%), Colville (7.4%, a difference of 1.5%), Hopi (7.4%, a difference of 2.0%), Dominican (7.5%, a difference of 2.6%), and Lumbee (7.1%, a difference of 2.8%).
| Demographics | Rating | Rank | Unemployment Among Women with Children Under 18 years |
| Immigrants | Dominica | 0.0 /100 | #325 | Tragic 7.0% |
| Chippewa | 0.0 /100 | #326 | Tragic 7.0% |
| Lumbee | 0.0 /100 | #327 | Tragic 7.1% |
| Natives/Alaskans | 0.0 /100 | #328 | Tragic 7.2% |
| Blacks/African Americans | 0.0 /100 | #329 | Tragic 7.3% |
| Colville | 0.0 /100 | #330 | Tragic 7.4% |
| Hopi | 0.0 /100 | #331 | Tragic 7.4% |
| Dominicans | 0.0 /100 | #332 | Tragic 7.5% |
| Immigrants | Dominican Republic | 0.0 /100 | #333 | Tragic 7.5% |
| Cheyenne | 0.0 /100 | #334 | Tragic 7.8% |
| Apache | 0.0 /100 | #335 | Tragic 7.9% |
| Sioux | 0.0 /100 | #336 | Tragic 7.9% |
| Yakama | 0.0 /100 | #337 | Tragic 8.1% |
| Immigrants | Yemen | 0.0 /100 | #338 | Tragic 8.2% |
| Navajo | 0.0 /100 | #339 | Tragic 8.2% |
| Crow | 0.0 /100 | #340 | Tragic 8.2% |
| Tohono O'odham | 0.0 /100 | #341 | Tragic 8.9% |
| Puerto Ricans | 0.0 /100 | #342 | Tragic 9.0% |
| Arapaho | 0.0 /100 | #343 | Tragic 9.2% |
| Inupiat | 0.0 /100 | #344 | Tragic 9.6% |
| Yuman | 0.0 /100 | #345 | Tragic 9.8% |