Immigrants from Serbia vs Immigrants from Bolivia Unemployment Among Women with Children Under 18 years
COMPARE
Immigrants from Serbia
Immigrants from Bolivia
Unemployment Among Women with Children Under 18 years
Unemployment Among Women with Children Under 18 years Comparison
Immigrants from Serbia
Immigrants from Bolivia
5.1%
UNEMPLOYMENT AMONG WOMEN WITH CHILDREN UNDER 18 YEARS
98.2/ 100
METRIC RATING
54th/ 347
METRIC RANK
5.1%
UNEMPLOYMENT AMONG WOMEN WITH CHILDREN UNDER 18 YEARS
96.1/ 100
METRIC RATING
72nd/ 347
METRIC RANK
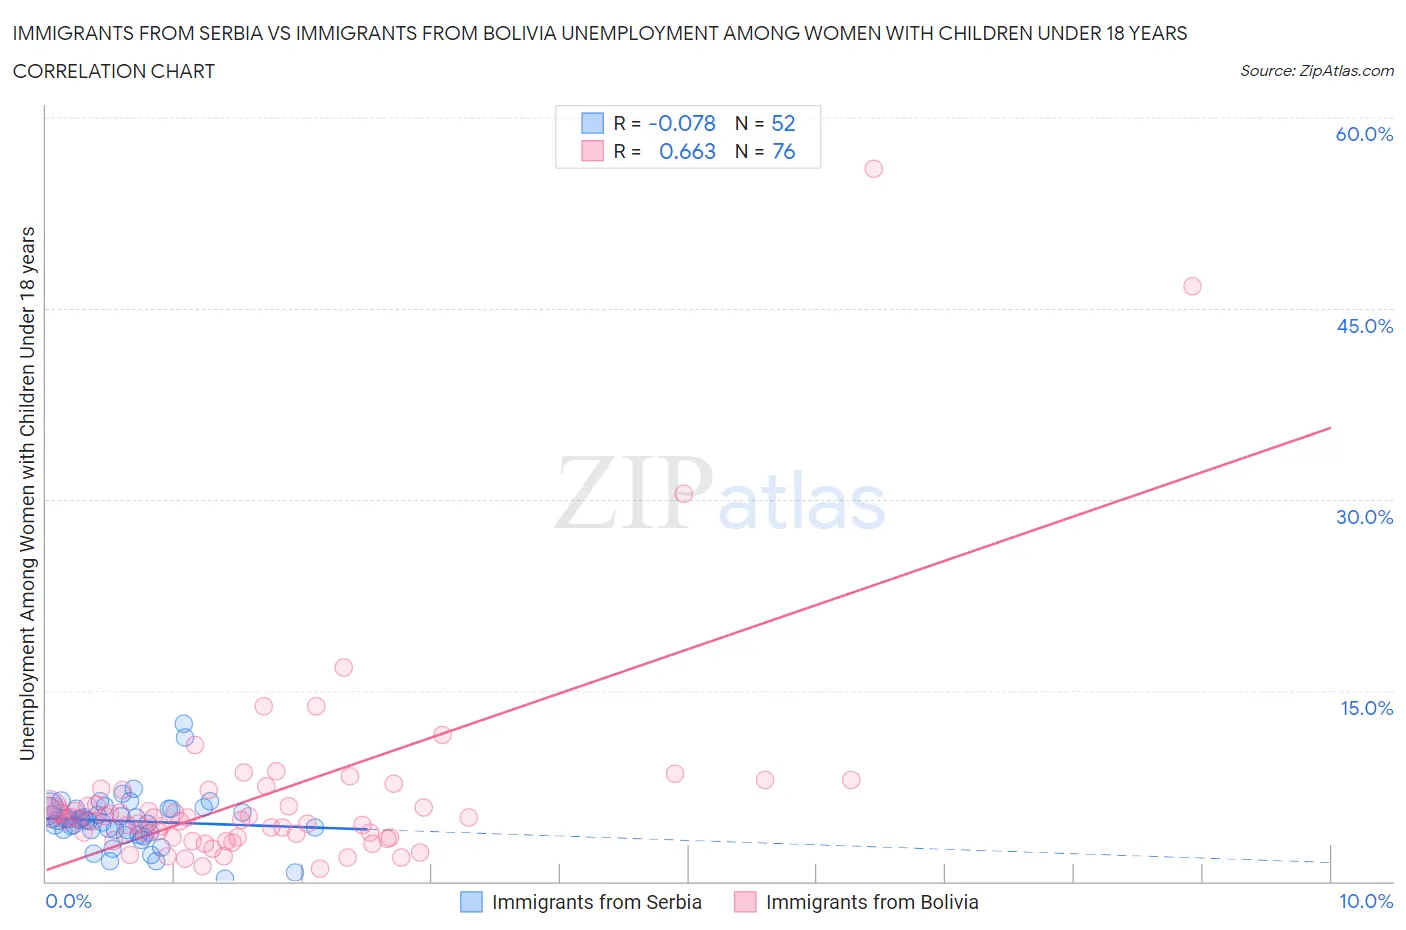
Immigrants from Serbia vs Immigrants from Bolivia Unemployment Among Women with Children Under 18 years Correlation Chart
The statistical analysis conducted on geographies consisting of 129,807,496 people shows a slight negative correlation between the proportion of Immigrants from Serbia and unemployment rate among women with children under the age of 18 in the United States with a correlation coefficient (R) of -0.078 and weighted average of 5.1%. Similarly, the statistical analysis conducted on geographies consisting of 156,676,474 people shows a significant positive correlation between the proportion of Immigrants from Bolivia and unemployment rate among women with children under the age of 18 in the United States with a correlation coefficient (R) of 0.663 and weighted average of 5.1%, a difference of 1.5%.
Unemployment Among Women with Children Under 18 years Correlation Summary
| Measurement | Immigrants from Serbia | Immigrants from Bolivia |
| Minimum | 0.20% | 1.0% |
| Maximum | 12.4% | 56.0% |
| Range | 12.2% | 55.0% |
| Mean | 4.7% | 6.8% |
| Median | 4.8% | 5.0% |
| Interquartile 25% (IQ1) | 3.9% | 3.5% |
| Interquartile 75% (IQ3) | 5.7% | 6.6% |
| Interquartile Range (IQR) | 1.8% | 3.1% |
| Standard Deviation (Sample) | 2.1% | 8.4% |
| Standard Deviation (Population) | 2.1% | 8.4% |
Demographics Similar to Immigrants from Serbia and Immigrants from Bolivia by Unemployment Among Women with Children Under 18 years
In terms of unemployment among women with children under 18 years, the demographic groups most similar to Immigrants from Serbia are Scottish (5.1%, a difference of 0.030%), Immigrants from Sri Lanka (5.1%, a difference of 0.13%), Immigrants from Ireland (5.1%, a difference of 0.17%), Czechoslovakian (5.1%, a difference of 0.23%), and Immigrants from Belgium (5.1%, a difference of 0.31%). Similarly, the demographic groups most similar to Immigrants from Bolivia are Albanian (5.1%, a difference of 0.070%), Serbian (5.1%, a difference of 0.22%), Austrian (5.1%, a difference of 0.26%), Icelander (5.1%, a difference of 0.26%), and Irish (5.1%, a difference of 0.40%).
| Demographics | Rating | Rank | Unemployment Among Women with Children Under 18 years |
| Scottish | 98.2 /100 | #53 | Exceptional 5.1% |
| Immigrants | Serbia | 98.2 /100 | #54 | Exceptional 5.1% |
| Immigrants | Sri Lanka | 98.1 /100 | #55 | Exceptional 5.1% |
| Immigrants | Ireland | 98.0 /100 | #56 | Exceptional 5.1% |
| Czechoslovakians | 98.0 /100 | #57 | Exceptional 5.1% |
| Immigrants | Belgium | 97.9 /100 | #58 | Exceptional 5.1% |
| Asians | 97.9 /100 | #59 | Exceptional 5.1% |
| Welsh | 97.7 /100 | #60 | Exceptional 5.1% |
| Russians | 97.5 /100 | #61 | Exceptional 5.1% |
| Immigrants | Bulgaria | 97.4 /100 | #62 | Exceptional 5.1% |
| Italians | 97.4 /100 | #63 | Exceptional 5.1% |
| Estonians | 97.2 /100 | #64 | Exceptional 5.1% |
| Immigrants | Sweden | 97.1 /100 | #65 | Exceptional 5.1% |
| Immigrants | Australia | 97.0 /100 | #66 | Exceptional 5.1% |
| Fijians | 96.9 /100 | #67 | Exceptional 5.1% |
| Irish | 96.8 /100 | #68 | Exceptional 5.1% |
| Austrians | 96.6 /100 | #69 | Exceptional 5.1% |
| Icelanders | 96.6 /100 | #70 | Exceptional 5.1% |
| Serbians | 96.5 /100 | #71 | Exceptional 5.1% |
| Immigrants | Bolivia | 96.1 /100 | #72 | Exceptional 5.1% |
| Albanians | 95.9 /100 | #73 | Exceptional 5.1% |