Subsaharan African vs Immigrants from Bolivia Unemployment Among Women with Children Under 18 years
COMPARE
Subsaharan African
Immigrants from Bolivia
Unemployment Among Women with Children Under 18 years
Unemployment Among Women with Children Under 18 years Comparison
Sub-Saharan Africans
Immigrants from Bolivia
6.2%
UNEMPLOYMENT AMONG WOMEN WITH CHILDREN UNDER 18 YEARS
0.1/ 100
METRIC RATING
266th/ 347
METRIC RANK
5.1%
UNEMPLOYMENT AMONG WOMEN WITH CHILDREN UNDER 18 YEARS
96.1/ 100
METRIC RATING
72nd/ 347
METRIC RANK
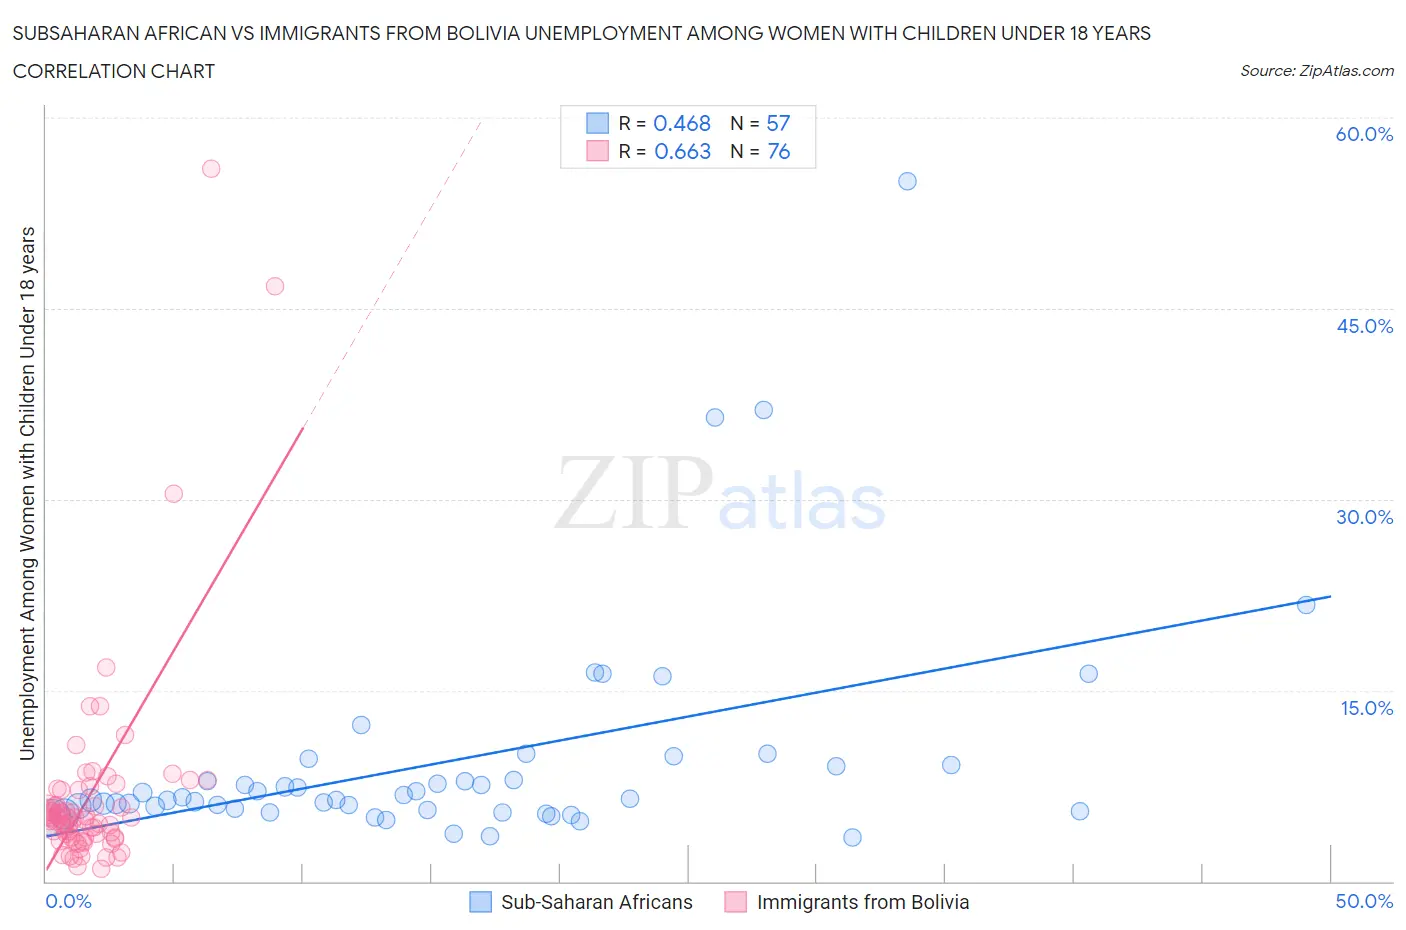
Subsaharan African vs Immigrants from Bolivia Unemployment Among Women with Children Under 18 years Correlation Chart
The statistical analysis conducted on geographies consisting of 479,418,047 people shows a moderate positive correlation between the proportion of Sub-Saharan Africans and unemployment rate among women with children under the age of 18 in the United States with a correlation coefficient (R) of 0.468 and weighted average of 6.2%. Similarly, the statistical analysis conducted on geographies consisting of 156,676,474 people shows a significant positive correlation between the proportion of Immigrants from Bolivia and unemployment rate among women with children under the age of 18 in the United States with a correlation coefficient (R) of 0.663 and weighted average of 5.1%, a difference of 20.1%.
Unemployment Among Women with Children Under 18 years Correlation Summary
| Measurement | Subsaharan African | Immigrants from Bolivia |
| Minimum | 3.4% | 1.0% |
| Maximum | 55.0% | 56.0% |
| Range | 51.6% | 55.0% |
| Mean | 9.5% | 6.8% |
| Median | 6.5% | 5.0% |
| Interquartile 25% (IQ1) | 5.5% | 3.5% |
| Interquartile 75% (IQ3) | 9.1% | 6.6% |
| Interquartile Range (IQR) | 3.5% | 3.1% |
| Standard Deviation (Sample) | 8.9% | 8.4% |
| Standard Deviation (Population) | 8.8% | 8.4% |
Similar Demographics by Unemployment Among Women with Children Under 18 years
Demographics Similar to Sub-Saharan Africans by Unemployment Among Women with Children Under 18 years
In terms of unemployment among women with children under 18 years, the demographic groups most similar to Sub-Saharan Africans are French American Indian (6.2%, a difference of 0.010%), Trinidadian and Tobagonian (6.2%, a difference of 0.030%), Cajun (6.2%, a difference of 0.070%), Ghanaian (6.2%, a difference of 0.070%), and Immigrants from Bahamas (6.1%, a difference of 0.33%).
| Demographics | Rating | Rank | Unemployment Among Women with Children Under 18 years |
| Ottawa | 0.1 /100 | #259 | Tragic 6.1% |
| Nigerians | 0.1 /100 | #260 | Tragic 6.1% |
| Immigrants | Liberia | 0.1 /100 | #261 | Tragic 6.1% |
| Immigrants | Trinidad and Tobago | 0.1 /100 | #262 | Tragic 6.1% |
| Spanish American Indians | 0.1 /100 | #263 | Tragic 6.1% |
| Comanche | 0.1 /100 | #264 | Tragic 6.1% |
| Immigrants | Bahamas | 0.1 /100 | #265 | Tragic 6.1% |
| Sub-Saharan Africans | 0.1 /100 | #266 | Tragic 6.2% |
| French American Indians | 0.1 /100 | #267 | Tragic 6.2% |
| Trinidadians and Tobagonians | 0.1 /100 | #268 | Tragic 6.2% |
| Cajuns | 0.1 /100 | #269 | Tragic 6.2% |
| Ghanaians | 0.1 /100 | #270 | Tragic 6.2% |
| Central Americans | 0.0 /100 | #271 | Tragic 6.2% |
| Salvadorans | 0.0 /100 | #272 | Tragic 6.2% |
| Immigrants | Western Africa | 0.0 /100 | #273 | Tragic 6.2% |
Demographics Similar to Immigrants from Bolivia by Unemployment Among Women with Children Under 18 years
In terms of unemployment among women with children under 18 years, the demographic groups most similar to Immigrants from Bolivia are Albanian (5.1%, a difference of 0.070%), Immigrants from Northern Europe (5.1%, a difference of 0.080%), Immigrants from Asia (5.1%, a difference of 0.11%), Puget Sound Salish (5.1%, a difference of 0.14%), and Zimbabwean (5.1%, a difference of 0.16%).
| Demographics | Rating | Rank | Unemployment Among Women with Children Under 18 years |
| Immigrants | Sweden | 97.1 /100 | #65 | Exceptional 5.1% |
| Immigrants | Australia | 97.0 /100 | #66 | Exceptional 5.1% |
| Fijians | 96.9 /100 | #67 | Exceptional 5.1% |
| Irish | 96.8 /100 | #68 | Exceptional 5.1% |
| Austrians | 96.6 /100 | #69 | Exceptional 5.1% |
| Icelanders | 96.6 /100 | #70 | Exceptional 5.1% |
| Serbians | 96.5 /100 | #71 | Exceptional 5.1% |
| Immigrants | Bolivia | 96.1 /100 | #72 | Exceptional 5.1% |
| Albanians | 95.9 /100 | #73 | Exceptional 5.1% |
| Immigrants | Northern Europe | 95.9 /100 | #74 | Exceptional 5.1% |
| Immigrants | Asia | 95.8 /100 | #75 | Exceptional 5.1% |
| Puget Sound Salish | 95.8 /100 | #76 | Exceptional 5.1% |
| Zimbabweans | 95.7 /100 | #77 | Exceptional 5.1% |
| Assyrians/Chaldeans/Syriacs | 95.7 /100 | #78 | Exceptional 5.1% |
| Immigrants | Croatia | 95.6 /100 | #79 | Exceptional 5.1% |