Dominican vs Dutch Unemployment Among Ages 30 to 34 years
COMPARE
Dominican
Dutch
Unemployment Among Ages 30 to 34 years
Unemployment Among Ages 30 to 34 years Comparison
Dominicans
Dutch
7.7%
UNEMPLOYMENT AMONG AGES 30 TO 34 YEARS
0.0/ 100
METRIC RATING
326th/ 347
METRIC RANK
5.5%
UNEMPLOYMENT AMONG AGES 30 TO 34 YEARS
52.6/ 100
METRIC RATING
170th/ 347
METRIC RANK
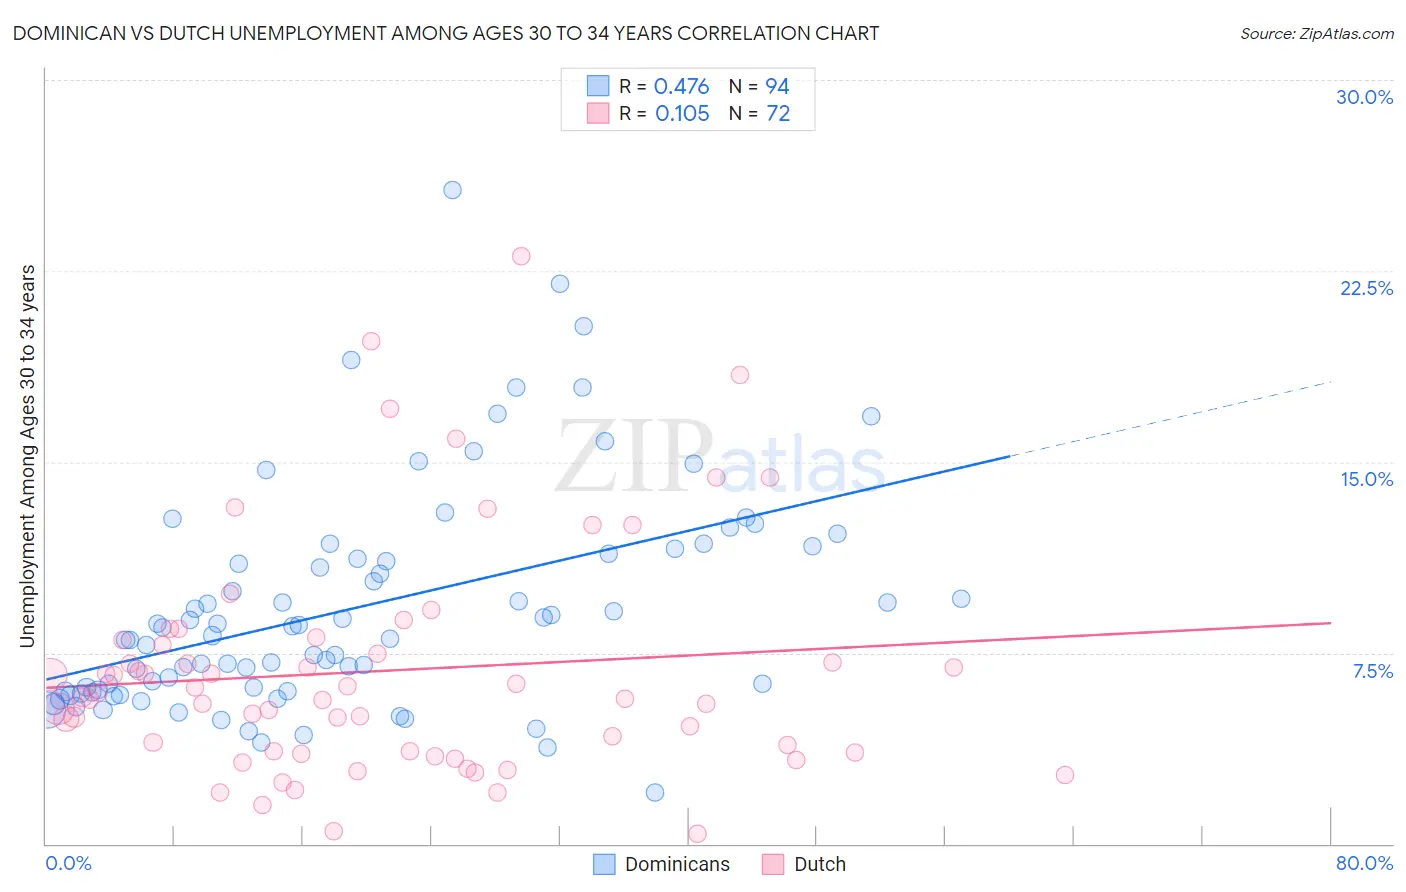
Dominican vs Dutch Unemployment Among Ages 30 to 34 years Correlation Chart
The statistical analysis conducted on geographies consisting of 337,372,860 people shows a moderate positive correlation between the proportion of Dominicans and unemployment rate among population between the ages 30 and 34 in the United States with a correlation coefficient (R) of 0.476 and weighted average of 7.7%. Similarly, the statistical analysis conducted on geographies consisting of 486,869,178 people shows a poor positive correlation between the proportion of Dutch and unemployment rate among population between the ages 30 and 34 in the United States with a correlation coefficient (R) of 0.105 and weighted average of 5.5%, a difference of 40.9%.
Unemployment Among Ages 30 to 34 years Correlation Summary
| Measurement | Dominican | Dutch |
| Minimum | 2.0% | 0.41% |
| Maximum | 25.7% | 23.1% |
| Range | 23.7% | 22.7% |
| Mean | 9.3% | 6.8% |
| Median | 8.3% | 5.7% |
| Interquartile 25% (IQ1) | 6.0% | 3.6% |
| Interquartile 75% (IQ3) | 11.4% | 7.9% |
| Interquartile Range (IQR) | 5.4% | 4.3% |
| Standard Deviation (Sample) | 4.4% | 4.5% |
| Standard Deviation (Population) | 4.3% | 4.5% |
Similar Demographics by Unemployment Among Ages 30 to 34 years
Demographics Similar to Dominicans by Unemployment Among Ages 30 to 34 years
In terms of unemployment among ages 30 to 34 years, the demographic groups most similar to Dominicans are Immigrants from Dominican Republic (7.7%, a difference of 0.72%), Chippewa (7.8%, a difference of 0.99%), Cheyenne (7.8%, a difference of 2.1%), Shoshone (7.9%, a difference of 3.0%), and Sioux (8.0%, a difference of 4.4%).
| Demographics | Rating | Rank | Unemployment Among Ages 30 to 34 years |
| Guyanese | 0.0 /100 | #319 | Tragic 7.2% |
| Cape Verdeans | 0.0 /100 | #320 | Tragic 7.2% |
| Immigrants | Guyana | 0.0 /100 | #321 | Tragic 7.2% |
| Marshallese | 0.0 /100 | #322 | Tragic 7.2% |
| Immigrants | Yemen | 0.0 /100 | #323 | Tragic 7.3% |
| Immigrants | Dominica | 0.0 /100 | #324 | Tragic 7.3% |
| Apache | 0.0 /100 | #325 | Tragic 7.3% |
| Dominicans | 0.0 /100 | #326 | Tragic 7.7% |
| Immigrants | Dominican Republic | 0.0 /100 | #327 | Tragic 7.7% |
| Chippewa | 0.0 /100 | #328 | Tragic 7.8% |
| Cheyenne | 0.0 /100 | #329 | Tragic 7.8% |
| Shoshone | 0.0 /100 | #330 | Tragic 7.9% |
| Sioux | 0.0 /100 | #331 | Tragic 8.0% |
| Natives/Alaskans | 0.0 /100 | #332 | Tragic 8.2% |
| Pueblo | 0.0 /100 | #333 | Tragic 8.3% |
Demographics Similar to Dutch by Unemployment Among Ages 30 to 34 years
In terms of unemployment among ages 30 to 34 years, the demographic groups most similar to Dutch are South American (5.4%, a difference of 0.020%), Immigrants from Israel (5.4%, a difference of 0.020%), Scottish (5.5%, a difference of 0.060%), Immigrants from Austria (5.5%, a difference of 0.090%), and English (5.4%, a difference of 0.15%).
| Demographics | Rating | Rank | Unemployment Among Ages 30 to 34 years |
| Arabs | 57.7 /100 | #163 | Average 5.4% |
| Basques | 57.3 /100 | #164 | Average 5.4% |
| Welsh | 56.3 /100 | #165 | Average 5.4% |
| Immigrants | Thailand | 55.6 /100 | #166 | Average 5.4% |
| English | 54.8 /100 | #167 | Average 5.4% |
| South Americans | 52.9 /100 | #168 | Average 5.4% |
| Immigrants | Israel | 52.9 /100 | #169 | Average 5.4% |
| Dutch | 52.6 /100 | #170 | Average 5.5% |
| Scottish | 51.8 /100 | #171 | Average 5.5% |
| Immigrants | Austria | 51.3 /100 | #172 | Average 5.5% |
| Peruvians | 50.2 /100 | #173 | Average 5.5% |
| Immigrants | Laos | 50.0 /100 | #174 | Average 5.5% |
| Afghans | 49.6 /100 | #175 | Average 5.5% |
| Immigrants | Peru | 48.0 /100 | #176 | Average 5.5% |
| Immigrants | Ukraine | 47.7 /100 | #177 | Average 5.5% |