Puerto Rican vs Dutch 2nd Grade
COMPARE
Puerto Rican
Dutch
2nd Grade
2nd Grade Comparison
Puerto Ricans
Dutch
97.5%
2ND GRADE
0.7/ 100
METRIC RATING
253rd/ 347
METRIC RANK
98.6%
2ND GRADE
100.0/ 100
METRIC RATING
16th/ 347
METRIC RANK
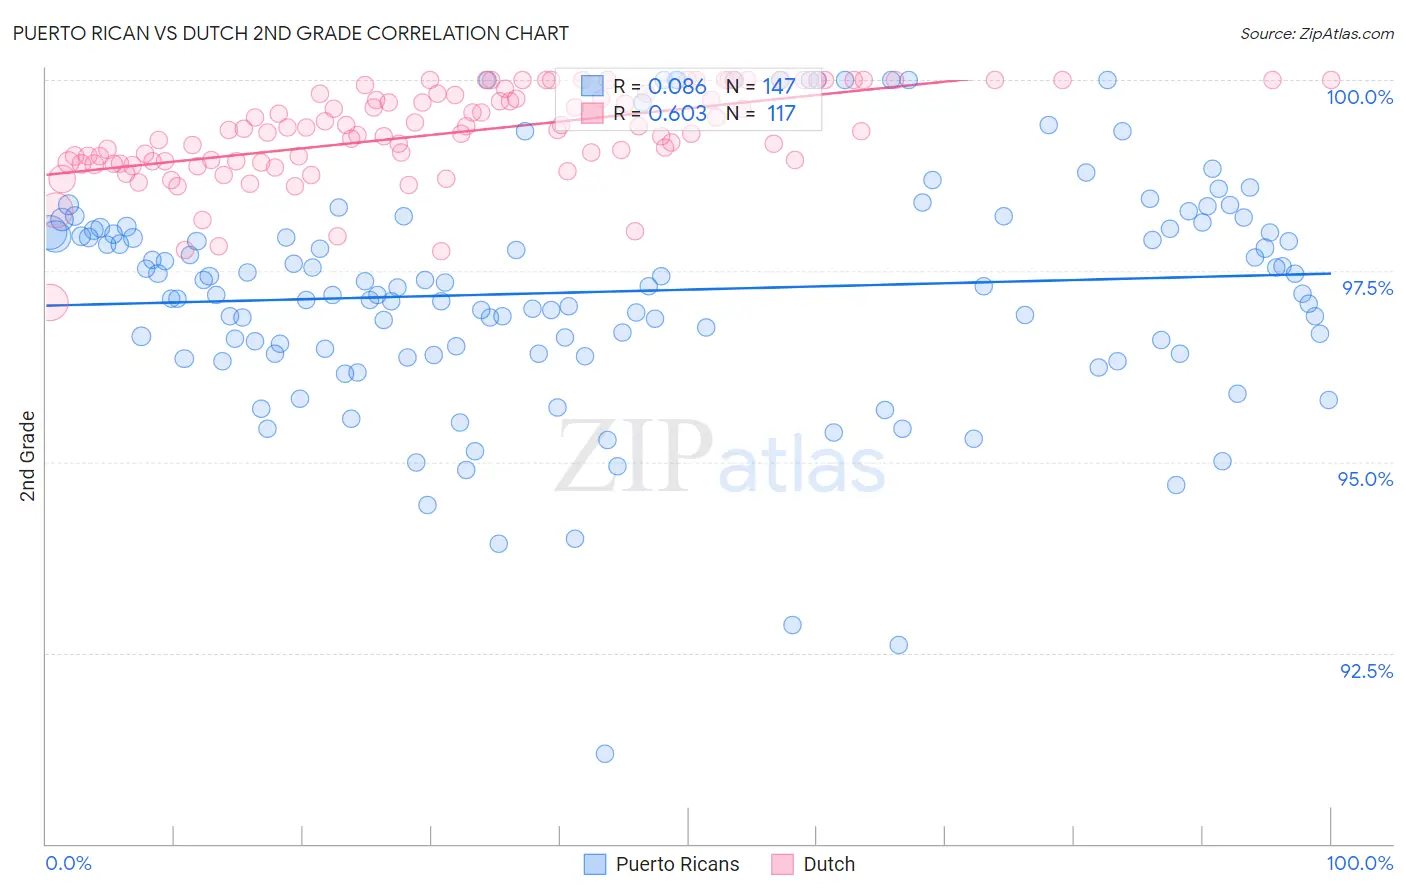
Puerto Rican vs Dutch 2nd Grade Correlation Chart
The statistical analysis conducted on geographies consisting of 528,320,522 people shows a slight positive correlation between the proportion of Puerto Ricans and percentage of population with at least 2nd grade education in the United States with a correlation coefficient (R) of 0.086 and weighted average of 97.5%. Similarly, the statistical analysis conducted on geographies consisting of 554,359,260 people shows a significant positive correlation between the proportion of Dutch and percentage of population with at least 2nd grade education in the United States with a correlation coefficient (R) of 0.603 and weighted average of 98.6%, a difference of 1.1%.
2nd Grade Correlation Summary
| Measurement | Puerto Rican | Dutch |
| Minimum | 91.2% | 97.1% |
| Maximum | 100.0% | 100.0% |
| Range | 8.8% | 2.9% |
| Mean | 97.2% | 99.3% |
| Median | 97.3% | 99.4% |
| Interquartile 25% (IQ1) | 96.4% | 98.9% |
| Interquartile 75% (IQ3) | 98.1% | 99.8% |
| Interquartile Range (IQR) | 1.6% | 0.89% |
| Standard Deviation (Sample) | 1.5% | 0.60% |
| Standard Deviation (Population) | 1.5% | 0.60% |
Similar Demographics by 2nd Grade
Demographics Similar to Puerto Ricans by 2nd Grade
In terms of 2nd grade, the demographic groups most similar to Puerto Ricans are Immigrants from Asia (97.5%, a difference of 0.0%), Immigrants from Africa (97.5%, a difference of 0.010%), Indian (Asian) (97.5%, a difference of 0.010%), Immigrants from Congo (97.5%, a difference of 0.010%), and South American (97.5%, a difference of 0.020%).
| Demographics | Rating | Rank | 2nd Grade |
| South Americans | 0.9 /100 | #246 | Tragic 97.5% |
| Immigrants | Senegal | 0.9 /100 | #247 | Tragic 97.5% |
| Immigrants | Middle Africa | 0.9 /100 | #248 | Tragic 97.5% |
| Bolivians | 0.9 /100 | #249 | Tragic 97.5% |
| Peruvians | 0.9 /100 | #250 | Tragic 97.5% |
| Immigrants | Africa | 0.8 /100 | #251 | Tragic 97.5% |
| Immigrants | Asia | 0.7 /100 | #252 | Tragic 97.5% |
| Puerto Ricans | 0.7 /100 | #253 | Tragic 97.5% |
| Indians (Asian) | 0.6 /100 | #254 | Tragic 97.5% |
| Immigrants | Congo | 0.6 /100 | #255 | Tragic 97.5% |
| Jamaicans | 0.6 /100 | #256 | Tragic 97.5% |
| Immigrants | Colombia | 0.5 /100 | #257 | Tragic 97.5% |
| Yaqui | 0.5 /100 | #258 | Tragic 97.5% |
| Fijians | 0.5 /100 | #259 | Tragic 97.5% |
| Assyrians/Chaldeans/Syriacs | 0.5 /100 | #260 | Tragic 97.5% |
Demographics Similar to Dutch by 2nd Grade
In terms of 2nd grade, the demographic groups most similar to Dutch are Scottish (98.6%, a difference of 0.010%), Swedish (98.6%, a difference of 0.020%), Aleut (98.6%, a difference of 0.020%), Irish (98.6%, a difference of 0.020%), and Finnish (98.5%, a difference of 0.030%).
| Demographics | Rating | Rank | 2nd Grade |
| Slovaks | 100.0 /100 | #9 | Exceptional 98.7% |
| Slovenes | 100.0 /100 | #10 | Exceptional 98.6% |
| Tlingit-Haida | 100.0 /100 | #11 | Exceptional 98.6% |
| Carpatho Rusyns | 100.0 /100 | #12 | Exceptional 98.6% |
| English | 100.0 /100 | #13 | Exceptional 98.6% |
| Swedes | 100.0 /100 | #14 | Exceptional 98.6% |
| Scottish | 100.0 /100 | #15 | Exceptional 98.6% |
| Dutch | 100.0 /100 | #16 | Exceptional 98.6% |
| Aleuts | 100.0 /100 | #17 | Exceptional 98.6% |
| Irish | 100.0 /100 | #18 | Exceptional 98.6% |
| Finns | 100.0 /100 | #19 | Exceptional 98.5% |
| Sioux | 100.0 /100 | #20 | Exceptional 98.5% |
| Lithuanians | 100.0 /100 | #21 | Exceptional 98.5% |
| Poles | 100.0 /100 | #22 | Exceptional 98.5% |
| Danes | 100.0 /100 | #23 | Exceptional 98.5% |