Immigrants from Turkey vs Black/African American Unemployment Among Women with Children Under 18 years
COMPARE
Immigrants from Turkey
Black/African American
Unemployment Among Women with Children Under 18 years
Unemployment Among Women with Children Under 18 years Comparison
Immigrants from Turkey
Blacks/African Americans
5.2%
UNEMPLOYMENT AMONG WOMEN WITH CHILDREN UNDER 18 YEARS
94.2/ 100
METRIC RATING
89th/ 347
METRIC RANK
7.3%
UNEMPLOYMENT AMONG WOMEN WITH CHILDREN UNDER 18 YEARS
0.0/ 100
METRIC RATING
329th/ 347
METRIC RANK
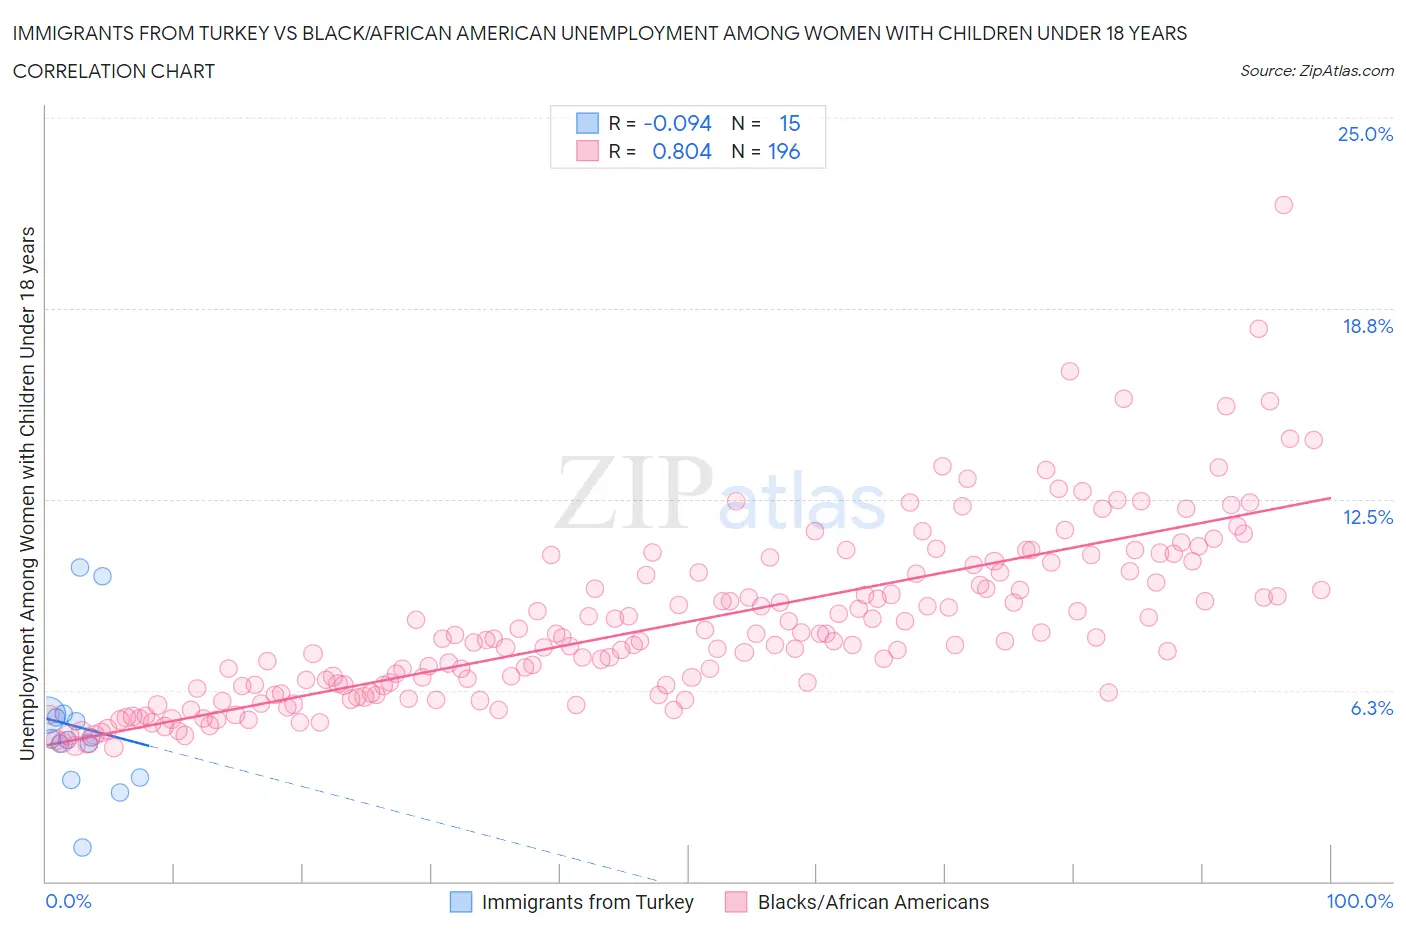
Immigrants from Turkey vs Black/African American Unemployment Among Women with Children Under 18 years Correlation Chart
The statistical analysis conducted on geographies consisting of 218,285,752 people shows a slight negative correlation between the proportion of Immigrants from Turkey and unemployment rate among women with children under the age of 18 in the United States with a correlation coefficient (R) of -0.094 and weighted average of 5.2%. Similarly, the statistical analysis conducted on geographies consisting of 516,708,014 people shows a very strong positive correlation between the proportion of Blacks/African Americans and unemployment rate among women with children under the age of 18 in the United States with a correlation coefficient (R) of 0.804 and weighted average of 7.3%, a difference of 40.6%.
Unemployment Among Women with Children Under 18 years Correlation Summary
| Measurement | Immigrants from Turkey | Black/African American |
| Minimum | 1.1% | 4.4% |
| Maximum | 10.3% | 22.1% |
| Range | 9.2% | 17.7% |
| Mean | 5.0% | 8.4% |
| Median | 4.7% | 7.9% |
| Interquartile 25% (IQ1) | 3.4% | 6.2% |
| Interquartile 75% (IQ3) | 5.4% | 10.1% |
| Interquartile Range (IQR) | 2.0% | 3.9% |
| Standard Deviation (Sample) | 2.4% | 2.9% |
| Standard Deviation (Population) | 2.3% | 2.9% |
Similar Demographics by Unemployment Among Women with Children Under 18 years
Demographics Similar to Immigrants from Turkey by Unemployment Among Women with Children Under 18 years
In terms of unemployment among women with children under 18 years, the demographic groups most similar to Immigrants from Turkey are Immigrants from Scotland (5.2%, a difference of 0.10%), Ukrainian (5.2%, a difference of 0.13%), Laotian (5.2%, a difference of 0.17%), Immigrants from Indonesia (5.2%, a difference of 0.20%), and Paraguayan (5.2%, a difference of 0.21%).
| Demographics | Rating | Rank | Unemployment Among Women with Children Under 18 years |
| Romanians | 95.3 /100 | #82 | Exceptional 5.2% |
| Maltese | 95.1 /100 | #83 | Exceptional 5.2% |
| Australians | 95.1 /100 | #84 | Exceptional 5.2% |
| Paraguayans | 94.8 /100 | #85 | Exceptional 5.2% |
| Immigrants | Indonesia | 94.8 /100 | #86 | Exceptional 5.2% |
| Laotians | 94.7 /100 | #87 | Exceptional 5.2% |
| Immigrants | Scotland | 94.5 /100 | #88 | Exceptional 5.2% |
| Immigrants | Turkey | 94.2 /100 | #89 | Exceptional 5.2% |
| Ukrainians | 93.8 /100 | #90 | Exceptional 5.2% |
| Immigrants | Zimbabwe | 93.6 /100 | #91 | Exceptional 5.2% |
| Immigrants | Pakistan | 93.3 /100 | #92 | Exceptional 5.2% |
| Immigrants | Canada | 93.3 /100 | #93 | Exceptional 5.2% |
| Immigrants | Kuwait | 92.6 /100 | #94 | Exceptional 5.2% |
| Immigrants | North America | 92.3 /100 | #95 | Exceptional 5.2% |
| Immigrants | Albania | 92.2 /100 | #96 | Exceptional 5.2% |
Demographics Similar to Blacks/African Americans by Unemployment Among Women with Children Under 18 years
In terms of unemployment among women with children under 18 years, the demographic groups most similar to Blacks/African Americans are Native/Alaskan (7.2%, a difference of 0.41%), Colville (7.4%, a difference of 1.5%), Hopi (7.4%, a difference of 2.0%), Dominican (7.5%, a difference of 2.6%), and Lumbee (7.1%, a difference of 2.8%).
| Demographics | Rating | Rank | Unemployment Among Women with Children Under 18 years |
| Houma | 0.0 /100 | #322 | Tragic 6.8% |
| Pueblo | 0.0 /100 | #323 | Tragic 6.8% |
| Paiute | 0.0 /100 | #324 | Tragic 6.9% |
| Immigrants | Dominica | 0.0 /100 | #325 | Tragic 7.0% |
| Chippewa | 0.0 /100 | #326 | Tragic 7.0% |
| Lumbee | 0.0 /100 | #327 | Tragic 7.1% |
| Natives/Alaskans | 0.0 /100 | #328 | Tragic 7.2% |
| Blacks/African Americans | 0.0 /100 | #329 | Tragic 7.3% |
| Colville | 0.0 /100 | #330 | Tragic 7.4% |
| Hopi | 0.0 /100 | #331 | Tragic 7.4% |
| Dominicans | 0.0 /100 | #332 | Tragic 7.5% |
| Immigrants | Dominican Republic | 0.0 /100 | #333 | Tragic 7.5% |
| Cheyenne | 0.0 /100 | #334 | Tragic 7.8% |
| Apache | 0.0 /100 | #335 | Tragic 7.9% |
| Sioux | 0.0 /100 | #336 | Tragic 7.9% |