Assyrian/Chaldean/Syriac vs Black/African American Unemployment Among Women with Children Under 18 years
COMPARE
Assyrian/Chaldean/Syriac
Black/African American
Unemployment Among Women with Children Under 18 years
Unemployment Among Women with Children Under 18 years Comparison
Assyrians/Chaldeans/Syriacs
Blacks/African Americans
5.1%
UNEMPLOYMENT AMONG WOMEN WITH CHILDREN UNDER 18 YEARS
95.7/ 100
METRIC RATING
78th/ 347
METRIC RANK
7.3%
UNEMPLOYMENT AMONG WOMEN WITH CHILDREN UNDER 18 YEARS
0.0/ 100
METRIC RATING
329th/ 347
METRIC RANK
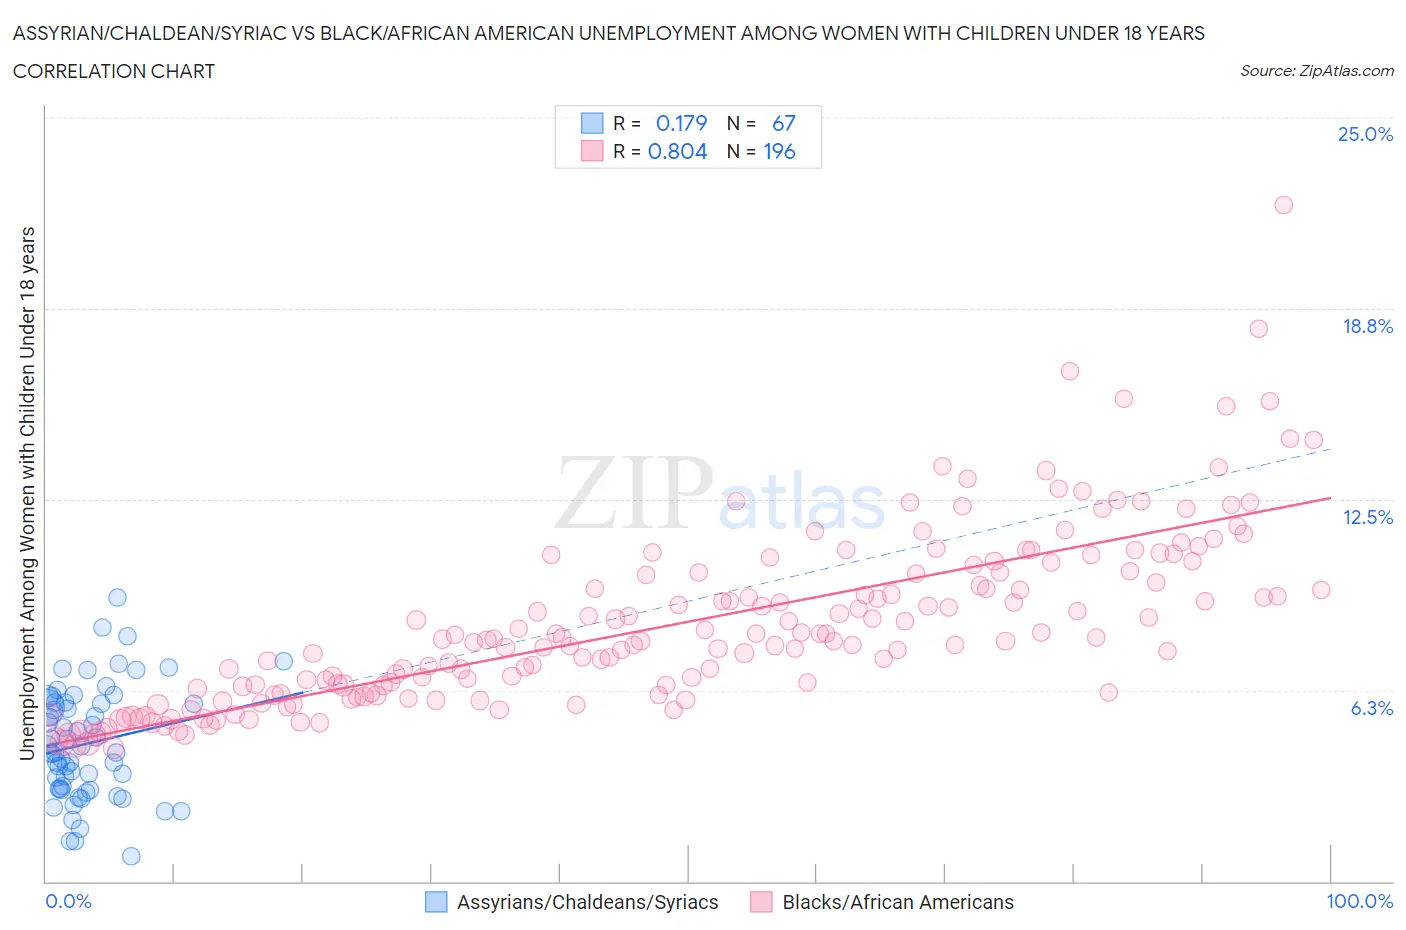
Assyrian/Chaldean/Syriac vs Black/African American Unemployment Among Women with Children Under 18 years Correlation Chart
The statistical analysis conducted on geographies consisting of 108,875,317 people shows a poor positive correlation between the proportion of Assyrians/Chaldeans/Syriacs and unemployment rate among women with children under the age of 18 in the United States with a correlation coefficient (R) of 0.179 and weighted average of 5.1%. Similarly, the statistical analysis conducted on geographies consisting of 516,708,014 people shows a very strong positive correlation between the proportion of Blacks/African Americans and unemployment rate among women with children under the age of 18 in the United States with a correlation coefficient (R) of 0.804 and weighted average of 7.3%, a difference of 41.4%.
Unemployment Among Women with Children Under 18 years Correlation Summary
| Measurement | Assyrian/Chaldean/Syriac | Black/African American |
| Minimum | 0.80% | 4.4% |
| Maximum | 9.3% | 22.1% |
| Range | 8.5% | 17.7% |
| Mean | 4.5% | 8.4% |
| Median | 4.2% | 7.9% |
| Interquartile 25% (IQ1) | 3.0% | 6.2% |
| Interquartile 75% (IQ3) | 5.8% | 10.1% |
| Interquartile Range (IQR) | 2.8% | 3.9% |
| Standard Deviation (Sample) | 1.8% | 2.9% |
| Standard Deviation (Population) | 1.8% | 2.9% |
Similar Demographics by Unemployment Among Women with Children Under 18 years
Demographics Similar to Assyrians/Chaldeans/Syriacs by Unemployment Among Women with Children Under 18 years
In terms of unemployment among women with children under 18 years, the demographic groups most similar to Assyrians/Chaldeans/Syriacs are Zimbabwean (5.1%, a difference of 0.020%), Immigrants from Croatia (5.1%, a difference of 0.020%), Puget Sound Salish (5.1%, a difference of 0.040%), Immigrants from Asia (5.1%, a difference of 0.070%), and Bolivian (5.1%, a difference of 0.070%).
| Demographics | Rating | Rank | Unemployment Among Women with Children Under 18 years |
| Serbians | 96.5 /100 | #71 | Exceptional 5.1% |
| Immigrants | Bolivia | 96.1 /100 | #72 | Exceptional 5.1% |
| Albanians | 95.9 /100 | #73 | Exceptional 5.1% |
| Immigrants | Northern Europe | 95.9 /100 | #74 | Exceptional 5.1% |
| Immigrants | Asia | 95.8 /100 | #75 | Exceptional 5.1% |
| Puget Sound Salish | 95.8 /100 | #76 | Exceptional 5.1% |
| Zimbabweans | 95.7 /100 | #77 | Exceptional 5.1% |
| Assyrians/Chaldeans/Syriacs | 95.7 /100 | #78 | Exceptional 5.1% |
| Immigrants | Croatia | 95.6 /100 | #79 | Exceptional 5.1% |
| Bolivians | 95.5 /100 | #80 | Exceptional 5.1% |
| Immigrants | Lithuania | 95.4 /100 | #81 | Exceptional 5.2% |
| Romanians | 95.3 /100 | #82 | Exceptional 5.2% |
| Maltese | 95.1 /100 | #83 | Exceptional 5.2% |
| Australians | 95.1 /100 | #84 | Exceptional 5.2% |
| Paraguayans | 94.8 /100 | #85 | Exceptional 5.2% |
Demographics Similar to Blacks/African Americans by Unemployment Among Women with Children Under 18 years
In terms of unemployment among women with children under 18 years, the demographic groups most similar to Blacks/African Americans are Native/Alaskan (7.2%, a difference of 0.41%), Colville (7.4%, a difference of 1.5%), Hopi (7.4%, a difference of 2.0%), Dominican (7.5%, a difference of 2.6%), and Lumbee (7.1%, a difference of 2.8%).
| Demographics | Rating | Rank | Unemployment Among Women with Children Under 18 years |
| Houma | 0.0 /100 | #322 | Tragic 6.8% |
| Pueblo | 0.0 /100 | #323 | Tragic 6.8% |
| Paiute | 0.0 /100 | #324 | Tragic 6.9% |
| Immigrants | Dominica | 0.0 /100 | #325 | Tragic 7.0% |
| Chippewa | 0.0 /100 | #326 | Tragic 7.0% |
| Lumbee | 0.0 /100 | #327 | Tragic 7.1% |
| Natives/Alaskans | 0.0 /100 | #328 | Tragic 7.2% |
| Blacks/African Americans | 0.0 /100 | #329 | Tragic 7.3% |
| Colville | 0.0 /100 | #330 | Tragic 7.4% |
| Hopi | 0.0 /100 | #331 | Tragic 7.4% |
| Dominicans | 0.0 /100 | #332 | Tragic 7.5% |
| Immigrants | Dominican Republic | 0.0 /100 | #333 | Tragic 7.5% |
| Cheyenne | 0.0 /100 | #334 | Tragic 7.8% |
| Apache | 0.0 /100 | #335 | Tragic 7.9% |
| Sioux | 0.0 /100 | #336 | Tragic 7.9% |