Pueblo vs Dominican Unemployment Among Ages 30 to 34 years
COMPARE
Pueblo
Dominican
Unemployment Among Ages 30 to 34 years
Unemployment Among Ages 30 to 34 years Comparison
Pueblo
Dominicans
8.3%
UNEMPLOYMENT AMONG AGES 30 TO 34 YEARS
0.0/ 100
METRIC RATING
333rd/ 347
METRIC RANK
7.7%
UNEMPLOYMENT AMONG AGES 30 TO 34 YEARS
0.0/ 100
METRIC RATING
326th/ 347
METRIC RANK
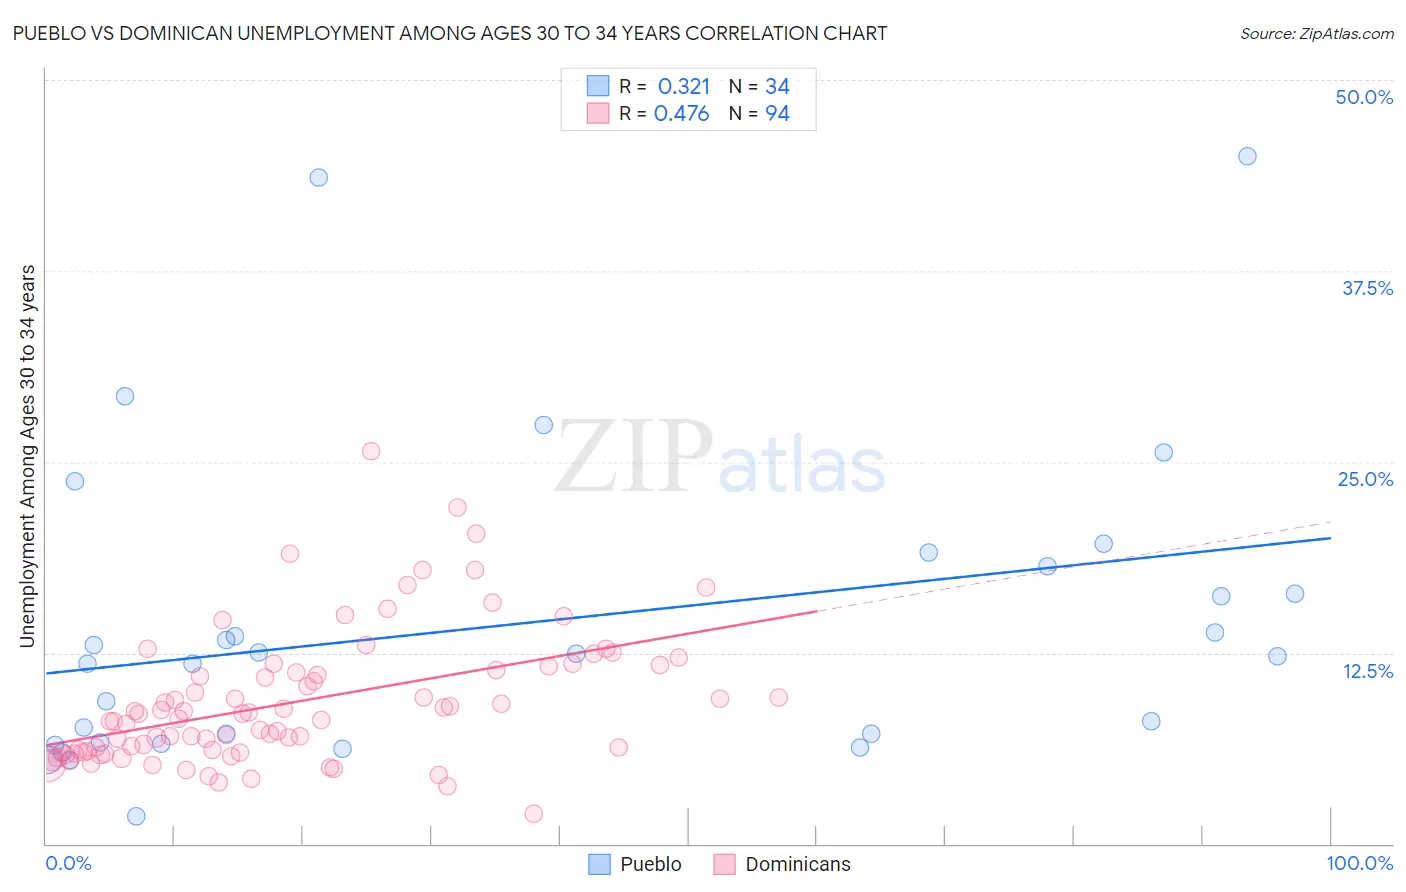
Pueblo vs Dominican Unemployment Among Ages 30 to 34 years Correlation Chart
The statistical analysis conducted on geographies consisting of 118,023,595 people shows a mild positive correlation between the proportion of Pueblo and unemployment rate among population between the ages 30 and 34 in the United States with a correlation coefficient (R) of 0.321 and weighted average of 8.3%. Similarly, the statistical analysis conducted on geographies consisting of 337,372,860 people shows a moderate positive correlation between the proportion of Dominicans and unemployment rate among population between the ages 30 and 34 in the United States with a correlation coefficient (R) of 0.476 and weighted average of 7.7%, a difference of 7.7%.
Unemployment Among Ages 30 to 34 years Correlation Summary
| Measurement | Pueblo | Dominican |
| Minimum | 1.8% | 2.0% |
| Maximum | 45.0% | 25.7% |
| Range | 43.2% | 23.7% |
| Mean | 14.4% | 9.3% |
| Median | 12.3% | 8.3% |
| Interquartile 25% (IQ1) | 6.6% | 6.0% |
| Interquartile 75% (IQ3) | 18.2% | 11.4% |
| Interquartile Range (IQR) | 11.6% | 5.4% |
| Standard Deviation (Sample) | 10.2% | 4.4% |
| Standard Deviation (Population) | 10.0% | 4.3% |
Demographics Similar to Pueblo and Dominicans by Unemployment Among Ages 30 to 34 years
In terms of unemployment among ages 30 to 34 years, the demographic groups most similar to Pueblo are Native/Alaskan (8.2%, a difference of 0.43%), Alaska Native (8.5%, a difference of 2.7%), Sioux (8.0%, a difference of 3.1%), Shoshone (7.9%, a difference of 4.5%), and Cheyenne (7.8%, a difference of 5.5%). Similarly, the demographic groups most similar to Dominicans are Immigrants from Dominican Republic (7.7%, a difference of 0.72%), Chippewa (7.8%, a difference of 0.99%), Cheyenne (7.8%, a difference of 2.1%), Shoshone (7.9%, a difference of 3.0%), and Sioux (8.0%, a difference of 4.4%).
| Demographics | Rating | Rank | Unemployment Among Ages 30 to 34 years |
| Guyanese | 0.0 /100 | #319 | Tragic 7.2% |
| Cape Verdeans | 0.0 /100 | #320 | Tragic 7.2% |
| Immigrants | Guyana | 0.0 /100 | #321 | Tragic 7.2% |
| Marshallese | 0.0 /100 | #322 | Tragic 7.2% |
| Immigrants | Yemen | 0.0 /100 | #323 | Tragic 7.3% |
| Immigrants | Dominica | 0.0 /100 | #324 | Tragic 7.3% |
| Apache | 0.0 /100 | #325 | Tragic 7.3% |
| Dominicans | 0.0 /100 | #326 | Tragic 7.7% |
| Immigrants | Dominican Republic | 0.0 /100 | #327 | Tragic 7.7% |
| Chippewa | 0.0 /100 | #328 | Tragic 7.8% |
| Cheyenne | 0.0 /100 | #329 | Tragic 7.8% |
| Shoshone | 0.0 /100 | #330 | Tragic 7.9% |
| Sioux | 0.0 /100 | #331 | Tragic 8.0% |
| Natives/Alaskans | 0.0 /100 | #332 | Tragic 8.2% |
| Pueblo | 0.0 /100 | #333 | Tragic 8.3% |
| Alaska Natives | 0.0 /100 | #334 | Tragic 8.5% |
| Puerto Ricans | 0.0 /100 | #335 | Tragic 8.9% |
| Colville | 0.0 /100 | #336 | Tragic 9.0% |
| Pima | 0.0 /100 | #337 | Tragic 9.6% |
| Yakama | 0.0 /100 | #338 | Tragic 9.8% |
| Tohono O'odham | 0.0 /100 | #339 | Tragic 9.8% |