Potawatomi vs Hawaiian Unemployment Among Women with Children Under 6 years
COMPARE
Potawatomi
Hawaiian
Unemployment Among Women with Children Under 6 years
Unemployment Among Women with Children Under 6 years Comparison
Potawatomi
Hawaiians
9.6%
UNEMPLOYMENT AMONG WOMEN WITH CHILDREN UNDER 6 YEARS
0.0/ 100
METRIC RATING
320th/ 347
METRIC RANK
8.2%
UNEMPLOYMENT AMONG WOMEN WITH CHILDREN UNDER 6 YEARS
1.8/ 100
METRIC RATING
243rd/ 347
METRIC RANK
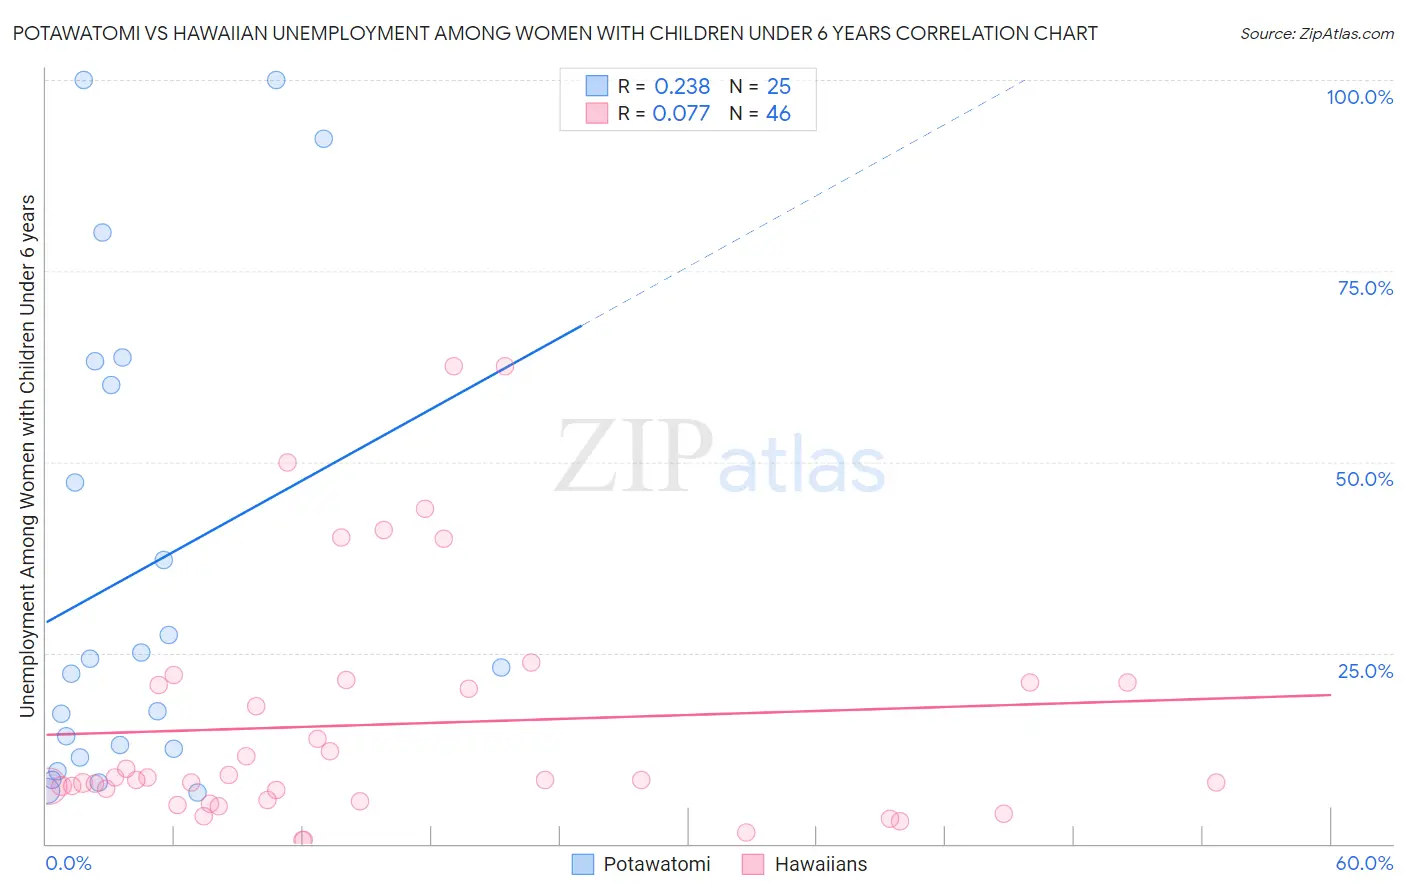
Potawatomi vs Hawaiian Unemployment Among Women with Children Under 6 years Correlation Chart
The statistical analysis conducted on geographies consisting of 103,199,576 people shows a weak positive correlation between the proportion of Potawatomi and unemployment rate among women with children under the age of 6 in the United States with a correlation coefficient (R) of 0.238 and weighted average of 9.6%. Similarly, the statistical analysis conducted on geographies consisting of 261,346,546 people shows a slight positive correlation between the proportion of Hawaiians and unemployment rate among women with children under the age of 6 in the United States with a correlation coefficient (R) of 0.077 and weighted average of 8.2%, a difference of 17.5%.
Unemployment Among Women with Children Under 6 years Correlation Summary
| Measurement | Potawatomi | Hawaiian |
| Minimum | 6.7% | 0.50% |
| Maximum | 100.0% | 62.5% |
| Range | 93.3% | 62.0% |
| Mean | 35.6% | 15.6% |
| Median | 23.1% | 8.3% |
| Interquartile 25% (IQ1) | 11.9% | 5.8% |
| Interquartile 75% (IQ3) | 61.6% | 21.1% |
| Interquartile Range (IQR) | 49.7% | 15.3% |
| Standard Deviation (Sample) | 31.0% | 15.8% |
| Standard Deviation (Population) | 30.4% | 15.6% |
Similar Demographics by Unemployment Among Women with Children Under 6 years
Demographics Similar to Potawatomi by Unemployment Among Women with Children Under 6 years
In terms of unemployment among women with children under 6 years, the demographic groups most similar to Potawatomi are Marshallese (9.6%, a difference of 0.050%), Central American Indian (9.6%, a difference of 0.060%), Alaska Native (9.6%, a difference of 0.31%), Immigrants from Bahamas (9.6%, a difference of 0.50%), and Osage (9.5%, a difference of 1.1%).
| Demographics | Rating | Rank | Unemployment Among Women with Children Under 6 years |
| Americans | 0.0 /100 | #313 | Tragic 9.3% |
| Fijians | 0.0 /100 | #314 | Tragic 9.3% |
| Cherokee | 0.0 /100 | #315 | Tragic 9.3% |
| Houma | 0.0 /100 | #316 | Tragic 9.4% |
| Dutch West Indians | 0.0 /100 | #317 | Tragic 9.5% |
| Osage | 0.0 /100 | #318 | Tragic 9.5% |
| Marshallese | 0.0 /100 | #319 | Tragic 9.6% |
| Potawatomi | 0.0 /100 | #320 | Tragic 9.6% |
| Central American Indians | 0.0 /100 | #321 | Tragic 9.6% |
| Alaska Natives | 0.0 /100 | #322 | Tragic 9.6% |
| Immigrants | Bahamas | 0.0 /100 | #323 | Tragic 9.6% |
| Paiute | 0.0 /100 | #324 | Tragic 9.7% |
| Choctaw | 0.0 /100 | #325 | Tragic 9.8% |
| Delaware | 0.0 /100 | #326 | Tragic 9.8% |
| Ottawa | 0.0 /100 | #327 | Tragic 9.9% |
Demographics Similar to Hawaiians by Unemployment Among Women with Children Under 6 years
In terms of unemployment among women with children under 6 years, the demographic groups most similar to Hawaiians are French (8.2%, a difference of 0.030%), Native Hawaiian (8.2%, a difference of 0.040%), Central American (8.2%, a difference of 0.37%), Dutch (8.1%, a difference of 0.56%), and Liberian (8.1%, a difference of 0.61%).
| Demographics | Rating | Rank | Unemployment Among Women with Children Under 6 years |
| Immigrants | Barbados | 4.2 /100 | #236 | Tragic 8.0% |
| Immigrants | Costa Rica | 4.1 /100 | #237 | Tragic 8.0% |
| Immigrants | Middle Africa | 3.2 /100 | #238 | Tragic 8.1% |
| Irish | 2.7 /100 | #239 | Tragic 8.1% |
| Immigrants | El Salvador | 2.6 /100 | #240 | Tragic 8.1% |
| Liberians | 2.6 /100 | #241 | Tragic 8.1% |
| Dutch | 2.5 /100 | #242 | Tragic 8.1% |
| Hawaiians | 1.8 /100 | #243 | Tragic 8.2% |
| French | 1.7 /100 | #244 | Tragic 8.2% |
| Native Hawaiians | 1.7 /100 | #245 | Tragic 8.2% |
| Central Americans | 1.4 /100 | #246 | Tragic 8.2% |
| German Russians | 1.2 /100 | #247 | Tragic 8.2% |
| Immigrants | Western Africa | 1.1 /100 | #248 | Tragic 8.2% |
| Immigrants | Sierra Leone | 1.1 /100 | #249 | Tragic 8.2% |
| Nigerians | 1.1 /100 | #250 | Tragic 8.2% |