Immigrants from Caribbean vs Hawaiian Unemployment Among Women with Children Under 6 years
COMPARE
Immigrants from Caribbean
Hawaiian
Unemployment Among Women with Children Under 6 years
Unemployment Among Women with Children Under 6 years Comparison
Immigrants from Caribbean
Hawaiians
8.3%
UNEMPLOYMENT AMONG WOMEN WITH CHILDREN UNDER 6 YEARS
0.7/ 100
METRIC RATING
254th/ 347
METRIC RANK
8.2%
UNEMPLOYMENT AMONG WOMEN WITH CHILDREN UNDER 6 YEARS
1.8/ 100
METRIC RATING
243rd/ 347
METRIC RANK
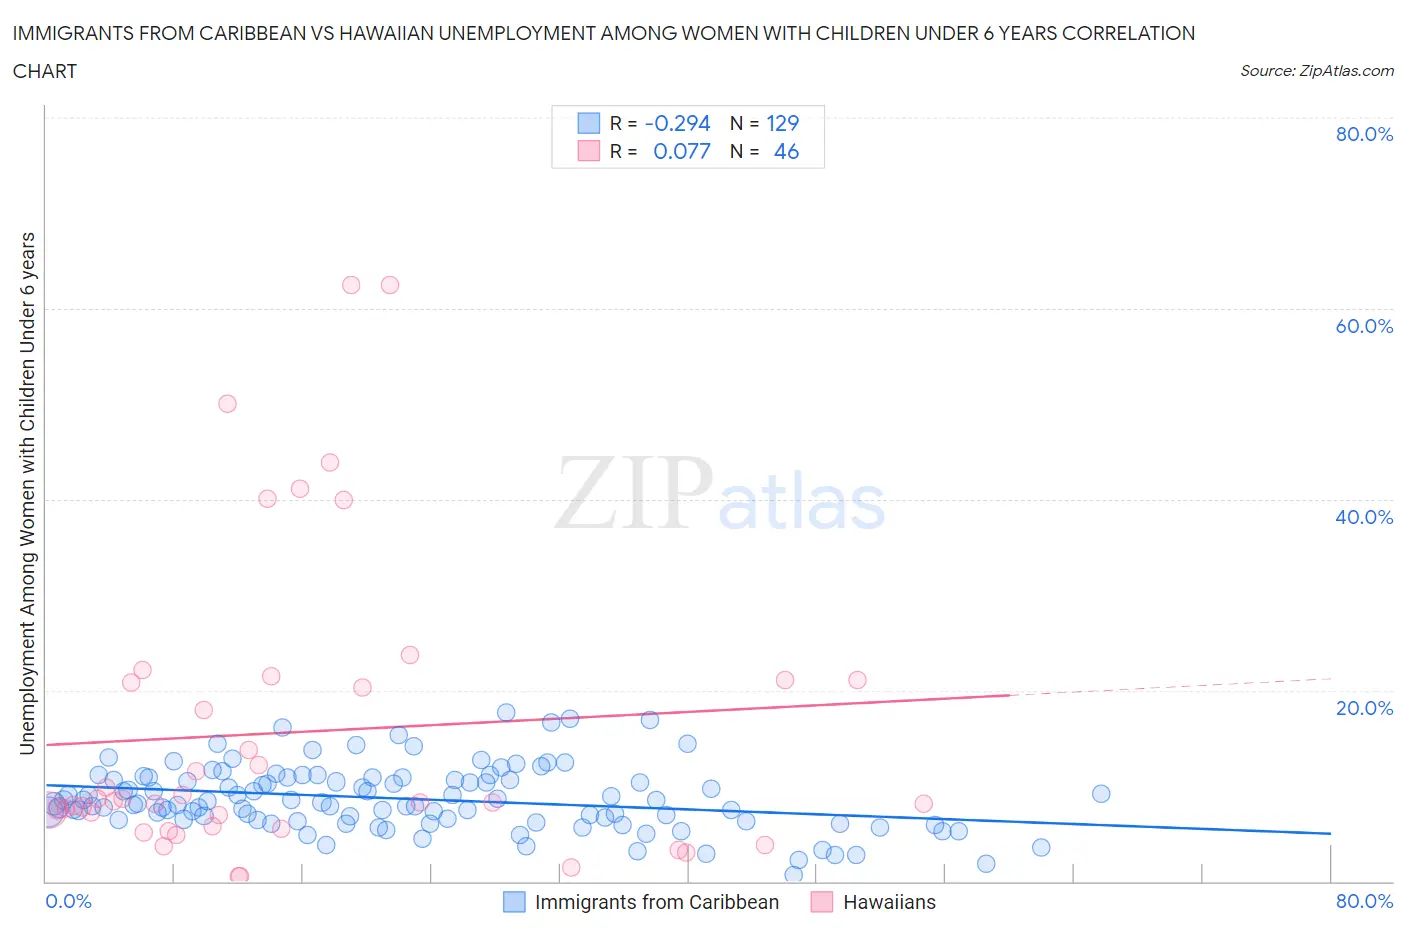
Immigrants from Caribbean vs Hawaiian Unemployment Among Women with Children Under 6 years Correlation Chart
The statistical analysis conducted on geographies consisting of 333,938,519 people shows a weak negative correlation between the proportion of Immigrants from Caribbean and unemployment rate among women with children under the age of 6 in the United States with a correlation coefficient (R) of -0.294 and weighted average of 8.3%. Similarly, the statistical analysis conducted on geographies consisting of 261,346,546 people shows a slight positive correlation between the proportion of Hawaiians and unemployment rate among women with children under the age of 6 in the United States with a correlation coefficient (R) of 0.077 and weighted average of 8.2%, a difference of 1.4%.
Unemployment Among Women with Children Under 6 years Correlation Summary
| Measurement | Immigrants from Caribbean | Hawaiian |
| Minimum | 0.70% | 0.50% |
| Maximum | 17.6% | 62.5% |
| Range | 16.9% | 62.0% |
| Mean | 8.6% | 15.6% |
| Median | 8.2% | 8.3% |
| Interquartile 25% (IQ1) | 6.4% | 5.8% |
| Interquartile 75% (IQ3) | 10.7% | 21.1% |
| Interquartile Range (IQR) | 4.3% | 15.3% |
| Standard Deviation (Sample) | 3.3% | 15.8% |
| Standard Deviation (Population) | 3.3% | 15.6% |
Demographics Similar to Immigrants from Caribbean and Hawaiians by Unemployment Among Women with Children Under 6 years
In terms of unemployment among women with children under 6 years, the demographic groups most similar to Immigrants from Caribbean are Immigrants from Guyana (8.2%, a difference of 0.27%), Immigrants from Portugal (8.3%, a difference of 0.29%), Celtic (8.3%, a difference of 0.31%), Guyanese (8.2%, a difference of 0.44%), and Ghanaian (8.2%, a difference of 0.44%). Similarly, the demographic groups most similar to Hawaiians are French (8.2%, a difference of 0.030%), Native Hawaiian (8.2%, a difference of 0.040%), Central American (8.2%, a difference of 0.37%), Dutch (8.1%, a difference of 0.56%), and Liberian (8.1%, a difference of 0.61%).
| Demographics | Rating | Rank | Unemployment Among Women with Children Under 6 years |
| Immigrants | Middle Africa | 3.2 /100 | #238 | Tragic 8.1% |
| Irish | 2.7 /100 | #239 | Tragic 8.1% |
| Immigrants | El Salvador | 2.6 /100 | #240 | Tragic 8.1% |
| Liberians | 2.6 /100 | #241 | Tragic 8.1% |
| Dutch | 2.5 /100 | #242 | Tragic 8.1% |
| Hawaiians | 1.8 /100 | #243 | Tragic 8.2% |
| French | 1.7 /100 | #244 | Tragic 8.2% |
| Native Hawaiians | 1.7 /100 | #245 | Tragic 8.2% |
| Central Americans | 1.4 /100 | #246 | Tragic 8.2% |
| German Russians | 1.2 /100 | #247 | Tragic 8.2% |
| Immigrants | Western Africa | 1.1 /100 | #248 | Tragic 8.2% |
| Immigrants | Sierra Leone | 1.1 /100 | #249 | Tragic 8.2% |
| Nigerians | 1.1 /100 | #250 | Tragic 8.2% |
| Guyanese | 1.0 /100 | #251 | Tragic 8.2% |
| Ghanaians | 1.0 /100 | #252 | Tragic 8.2% |
| Immigrants | Guyana | 0.8 /100 | #253 | Tragic 8.2% |
| Immigrants | Caribbean | 0.7 /100 | #254 | Tragic 8.3% |
| Immigrants | Portugal | 0.6 /100 | #255 | Tragic 8.3% |
| Celtics | 0.6 /100 | #256 | Tragic 8.3% |
| British West Indians | 0.5 /100 | #257 | Tragic 8.3% |
| Immigrants | Ghana | 0.5 /100 | #258 | Tragic 8.3% |