Potawatomi vs Czechoslovakian Unemployment Among Women with Children Under 6 years
COMPARE
Potawatomi
Czechoslovakian
Unemployment Among Women with Children Under 6 years
Unemployment Among Women with Children Under 6 years Comparison
Potawatomi
Czechoslovakians
9.6%
UNEMPLOYMENT AMONG WOMEN WITH CHILDREN UNDER 6 YEARS
0.0/ 100
METRIC RATING
320th/ 347
METRIC RANK
7.7%
UNEMPLOYMENT AMONG WOMEN WITH CHILDREN UNDER 6 YEARS
38.4/ 100
METRIC RATING
188th/ 347
METRIC RANK
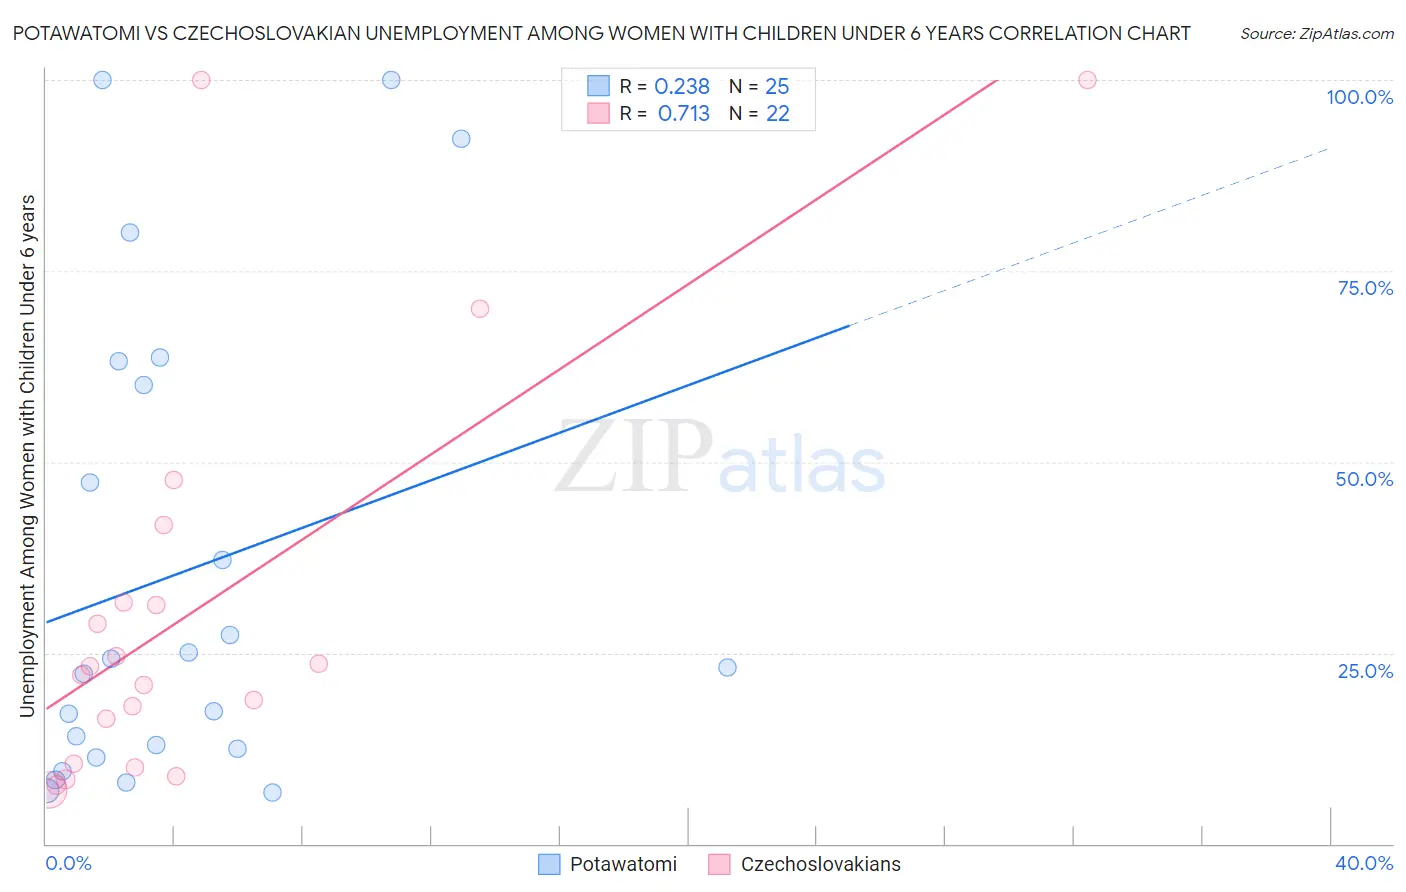
Potawatomi vs Czechoslovakian Unemployment Among Women with Children Under 6 years Correlation Chart
The statistical analysis conducted on geographies consisting of 103,199,576 people shows a weak positive correlation between the proportion of Potawatomi and unemployment rate among women with children under the age of 6 in the United States with a correlation coefficient (R) of 0.238 and weighted average of 9.6%. Similarly, the statistical analysis conducted on geographies consisting of 272,908,849 people shows a strong positive correlation between the proportion of Czechoslovakians and unemployment rate among women with children under the age of 6 in the United States with a correlation coefficient (R) of 0.713 and weighted average of 7.7%, a difference of 24.3%.
Unemployment Among Women with Children Under 6 years Correlation Summary
| Measurement | Potawatomi | Czechoslovakian |
| Minimum | 6.7% | 7.1% |
| Maximum | 100.0% | 100.0% |
| Range | 93.3% | 92.9% |
| Mean | 35.6% | 30.5% |
| Median | 23.1% | 22.7% |
| Interquartile 25% (IQ1) | 11.9% | 10.5% |
| Interquartile 75% (IQ3) | 61.6% | 31.6% |
| Interquartile Range (IQR) | 49.7% | 21.1% |
| Standard Deviation (Sample) | 31.0% | 27.0% |
| Standard Deviation (Population) | 30.4% | 26.4% |
Similar Demographics by Unemployment Among Women with Children Under 6 years
Demographics Similar to Potawatomi by Unemployment Among Women with Children Under 6 years
In terms of unemployment among women with children under 6 years, the demographic groups most similar to Potawatomi are Marshallese (9.6%, a difference of 0.050%), Central American Indian (9.6%, a difference of 0.060%), Alaska Native (9.6%, a difference of 0.31%), Immigrants from Bahamas (9.6%, a difference of 0.50%), and Osage (9.5%, a difference of 1.1%).
| Demographics | Rating | Rank | Unemployment Among Women with Children Under 6 years |
| Americans | 0.0 /100 | #313 | Tragic 9.3% |
| Fijians | 0.0 /100 | #314 | Tragic 9.3% |
| Cherokee | 0.0 /100 | #315 | Tragic 9.3% |
| Houma | 0.0 /100 | #316 | Tragic 9.4% |
| Dutch West Indians | 0.0 /100 | #317 | Tragic 9.5% |
| Osage | 0.0 /100 | #318 | Tragic 9.5% |
| Marshallese | 0.0 /100 | #319 | Tragic 9.6% |
| Potawatomi | 0.0 /100 | #320 | Tragic 9.6% |
| Central American Indians | 0.0 /100 | #321 | Tragic 9.6% |
| Alaska Natives | 0.0 /100 | #322 | Tragic 9.6% |
| Immigrants | Bahamas | 0.0 /100 | #323 | Tragic 9.6% |
| Paiute | 0.0 /100 | #324 | Tragic 9.7% |
| Choctaw | 0.0 /100 | #325 | Tragic 9.8% |
| Delaware | 0.0 /100 | #326 | Tragic 9.8% |
| Ottawa | 0.0 /100 | #327 | Tragic 9.9% |
Demographics Similar to Czechoslovakians by Unemployment Among Women with Children Under 6 years
In terms of unemployment among women with children under 6 years, the demographic groups most similar to Czechoslovakians are Immigrants from Thailand (7.7%, a difference of 0.010%), Yugoslavian (7.7%, a difference of 0.060%), Spanish American (7.7%, a difference of 0.080%), Indonesian (7.7%, a difference of 0.14%), and Immigrants from Panama (7.7%, a difference of 0.20%).
| Demographics | Rating | Rank | Unemployment Among Women with Children Under 6 years |
| Brazilians | 43.9 /100 | #181 | Average 7.7% |
| Nepalese | 43.5 /100 | #182 | Average 7.7% |
| Sierra Leoneans | 42.9 /100 | #183 | Average 7.7% |
| Indonesians | 40.5 /100 | #184 | Average 7.7% |
| Spanish Americans | 39.7 /100 | #185 | Fair 7.7% |
| Yugoslavians | 39.4 /100 | #186 | Fair 7.7% |
| Immigrants | Thailand | 38.5 /100 | #187 | Fair 7.7% |
| Czechoslovakians | 38.4 /100 | #188 | Fair 7.7% |
| Immigrants | Panama | 35.7 /100 | #189 | Fair 7.7% |
| Immigrants | North Macedonia | 34.4 /100 | #190 | Fair 7.7% |
| Immigrants | Austria | 32.4 /100 | #191 | Fair 7.7% |
| Immigrants | Africa | 32.4 /100 | #192 | Fair 7.7% |
| Slavs | 32.4 /100 | #193 | Fair 7.7% |
| Syrians | 31.9 /100 | #194 | Fair 7.7% |
| Malaysians | 31.1 /100 | #195 | Fair 7.7% |