Immigrants from Peru vs Hawaiian Unemployment Among Women with Children Under 6 years

COMPARE

Immigrants from Peru
Race
Ancestry
AfghanAfricanAlaska NativeAlaskan AthabascanAlbanianAleutAlsatianAmericanApacheArabArapahoArgentineanArmenianAssyrian/Chaldean/SyriacAustralianAustrianBahamianBangladeshiBarbadianBasqueBelgianBelizeanBermudanBhutaneseBlackfeetBolivianBrazilianBritishBritish West IndianBulgarianBurmeseCajunCambodianCanadianCape VerdeanCarpatho RusynCelticCentral AmericanCentral American IndianCherokeeCheyenneChickasawChileanChineseChippewaChoctawColombianColvilleComancheCosta RicanCreeCreekCroatianCrowCubanCypriotCzechCzechoslovakianDanishDelawareDominicanDutchDutch West IndianEastern EuropeanEcuadorianEgyptianEnglishEstonianEthiopianEuropeanFijianFilipinoFinnishFrenchFrench American IndianFrench CanadianGermanGerman RussianGhanaianGreekGuamanian/ChamorroGuatemalanGuyaneseHaitianHmongHonduranHopiHoumaHungarianIcelanderIndian (Asian)IndonesianInupiatIranianIraqiIrishIroquoisIsraeliItalianJamaicanJapaneseJordanianKenyanKiowaKoreanLaotianLatvianLebaneseLiberianLithuanianLumbeeLuxembourgerMacedonianMalaysianMalteseMarshalleseMenomineeMexicanMexican American IndianMongolianMoroccanNative HawaiianNavajoNepaleseNew ZealanderNicaraguanNigerianNorthern EuropeanNorwegianOkinawanOsageOttawaPaiutePakistaniPalestinianPanamanianParaguayanPennsylvania GermanPeruvianPimaPolishPortuguesePotawatomiPuebloPuerto RicanPuget Sound SalishRomanianRussianSalvadoranSamoanScandinavianScotch-IrishScottishSeminoleSenegaleseSerbianShoshoneSierra LeoneanSiouxSlavicSlovakSloveneSomaliSouth AfricanSouth AmericanSouth American IndianSoviet UnionSpaniardSpanishSpanish AmericanSpanish American IndianSri LankanSubsaharan AfricanSudaneseSwedishSwissSyrianTaiwaneseThaiTlingit-HaidaTohono O'OdhamTonganTrinidadian and TobagonianTsimshianTurkishU.S. Virgin IslanderUgandanUkrainianUruguayanUteVenezuelanVietnameseWelshWest IndianYakamaYaquiYugoslavianYumanYup'ikZimbabwean
Immigration
NonimmigrantsImmigrantsAfghanistanAfricaAlbaniaArgentinaArmeniaAsiaAustraliaAustriaBahamasBangladeshBarbadosBelarusBelgiumBelizeBoliviaBosnia and HerzegovinaBrazilBulgariaBurma/MyanmarCabo VerdeCambodiaCameroonCanadaCaribbeanCentral AmericaChileChinaColombiaCongoCosta RicaCroatiaCubaCzechoslovakiaDenmarkDominicaDominican RepublicEastern AfricaEastern AsiaEastern EuropeEcuadorEgyptEl SalvadorEnglandEritreaEthiopiaEuropeFijiFranceGermanyGhanaGreeceGrenadaGuatemalaGuyanaHaitiHondurasHong KongHungaryIndiaIndonesiaIranIraqIrelandIsraelItalyJamaicaJapanJordanKazakhstanKenyaKoreaKuwaitLaosLatin AmericaLatviaLebanonLiberiaLithuaniaMalaysiaMexicoMicronesiaMiddle AfricaMoldovaMoroccoNepalNetherlandsNicaraguaNigeriaNorth AmericaNorth MacedoniaNorthern AfricaNorthern EuropeNorwayOceaniaPakistanPanamaPeruPhilippinesPolandPortugalRomaniaRussiaSaudi ArabiaScotlandSenegalSerbiaSierra LeoneSingaporeSomaliaSouth AfricaSouth AmericaSouth Central AsiaSouth Eastern AsiaSouthern EuropeSpainSri LankaSt. Vincent and the GrenadinesSudanSwedenSwitzerlandSyriaTaiwanThailandTrinidad and TobagoTurkeyUgandaUkraineUruguayUzbekistanVenezuelaVietnamWest IndiesWestern AfricaWestern AsiaWestern EuropeYemenZaireZimbabweAzores
Hawaiian
Race
Ancestry
AfghanAfricanAlaska NativeAlaskan AthabascanAlbanianAleutAlsatianAmericanApacheArabArapahoArgentineanArmenianAssyrian/Chaldean/SyriacAustralianAustrianBahamianBangladeshiBarbadianBasqueBelgianBelizeanBermudanBhutaneseBlackfeetBolivianBrazilianBritishBritish West IndianBulgarianBurmeseCajunCambodianCanadianCape VerdeanCarpatho RusynCelticCentral AmericanCentral American IndianCherokeeCheyenneChickasawChileanChineseChippewaChoctawColombianColvilleComancheCosta RicanCreeCreekCroatianCrowCubanCypriotCzechCzechoslovakianDanishDelawareDominicanDutchDutch West IndianEastern EuropeanEcuadorianEgyptianEnglishEstonianEthiopianEuropeanFijianFilipinoFinnishFrenchFrench American IndianFrench CanadianGermanGerman RussianGhanaianGreekGuamanian/ChamorroGuatemalanGuyaneseHaitianHmongHonduranHopiHoumaHungarianIcelanderIndian (Asian)IndonesianInupiatIranianIraqiIrishIroquoisIsraeliItalianJamaicanJapaneseJordanianKenyanKiowaKoreanLaotianLatvianLebaneseLiberianLithuanianLumbeeLuxembourgerMacedonianMalaysianMalteseMarshalleseMenomineeMexicanMexican American IndianMongolianMoroccanNative HawaiianNavajoNepaleseNew ZealanderNicaraguanNigerianNorthern EuropeanNorwegianOkinawanOsageOttawaPaiutePakistaniPalestinianPanamanianParaguayanPennsylvania GermanPeruvianPimaPolishPortuguesePotawatomiPuebloPuerto RicanPuget Sound SalishRomanianRussianSalvadoranSamoanScandinavianScotch-IrishScottishSeminoleSenegaleseSerbianShoshoneSierra LeoneanSiouxSlavicSlovakSloveneSomaliSouth AfricanSouth AmericanSouth American IndianSoviet UnionSpaniardSpanishSpanish AmericanSpanish American IndianSri LankanSubsaharan AfricanSudaneseSwedishSwissSyrianTaiwaneseThaiTlingit-HaidaTohono O'OdhamTonganTrinidadian and TobagonianTsimshianTurkishU.S. Virgin IslanderUgandanUkrainianUruguayanUteVenezuelanVietnameseWelshWest IndianYakamaYaquiYugoslavianYumanYup'ikZimbabwean
Immigration
NonimmigrantsImmigrantsAfghanistanAfricaAlbaniaArgentinaArmeniaAsiaAustraliaAustriaBahamasBangladeshBarbadosBelarusBelgiumBelizeBoliviaBosnia and HerzegovinaBrazilBulgariaBurma/MyanmarCabo VerdeCambodiaCameroonCanadaCaribbeanCentral AmericaChileChinaColombiaCongoCosta RicaCroatiaCubaCzechoslovakiaDenmarkDominicaDominican RepublicEastern AfricaEastern AsiaEastern EuropeEcuadorEgyptEl SalvadorEnglandEritreaEthiopiaEuropeFijiFranceGermanyGhanaGreeceGrenadaGuatemalaGuyanaHaitiHondurasHong KongHungaryIndiaIndonesiaIranIraqIrelandIsraelItalyJamaicaJapanJordanKazakhstanKenyaKoreaKuwaitLaosLatin AmericaLatviaLebanonLiberiaLithuaniaMalaysiaMexicoMicronesiaMiddle AfricaMoldovaMoroccoNepalNetherlandsNicaraguaNigeriaNorth AmericaNorth MacedoniaNorthern AfricaNorthern EuropeNorwayOceaniaPakistanPanamaPhilippinesPolandPortugalRomaniaRussiaSaudi ArabiaScotlandSenegalSerbiaSierra LeoneSingaporeSomaliaSouth AfricaSouth AmericaSouth Central AsiaSouth Eastern AsiaSouthern EuropeSpainSri LankaSt. Vincent and the GrenadinesSudanSwedenSwitzerlandSyriaTaiwanThailandTrinidad and TobagoTurkeyUgandaUkraineUruguayUzbekistanVenezuelaVietnamWest IndiesWestern AfricaWestern AsiaWestern EuropeYemenZaireZimbabweAzores
Unemployment Among Women with Children Under 6 years
Income
Poverty
Unemployment
Labor Participation
Family Structure
Vehicle Availability
Education Level
Disability

Unemployment Among Women with Children Under 6 years Comparison

Immigrants from Peru

Hawaiians

Good
Tragic
7.5%
UNEMPLOYMENT AMONG WOMEN WITH CHILDREN UNDER 6 YEARS
74.9/ 100
METRIC RATING
151st/ 347
METRIC RANK
8.2%
UNEMPLOYMENT AMONG WOMEN WITH CHILDREN UNDER 6 YEARS
1.8/ 100
METRIC RATING
243rd/ 347
METRIC RANK

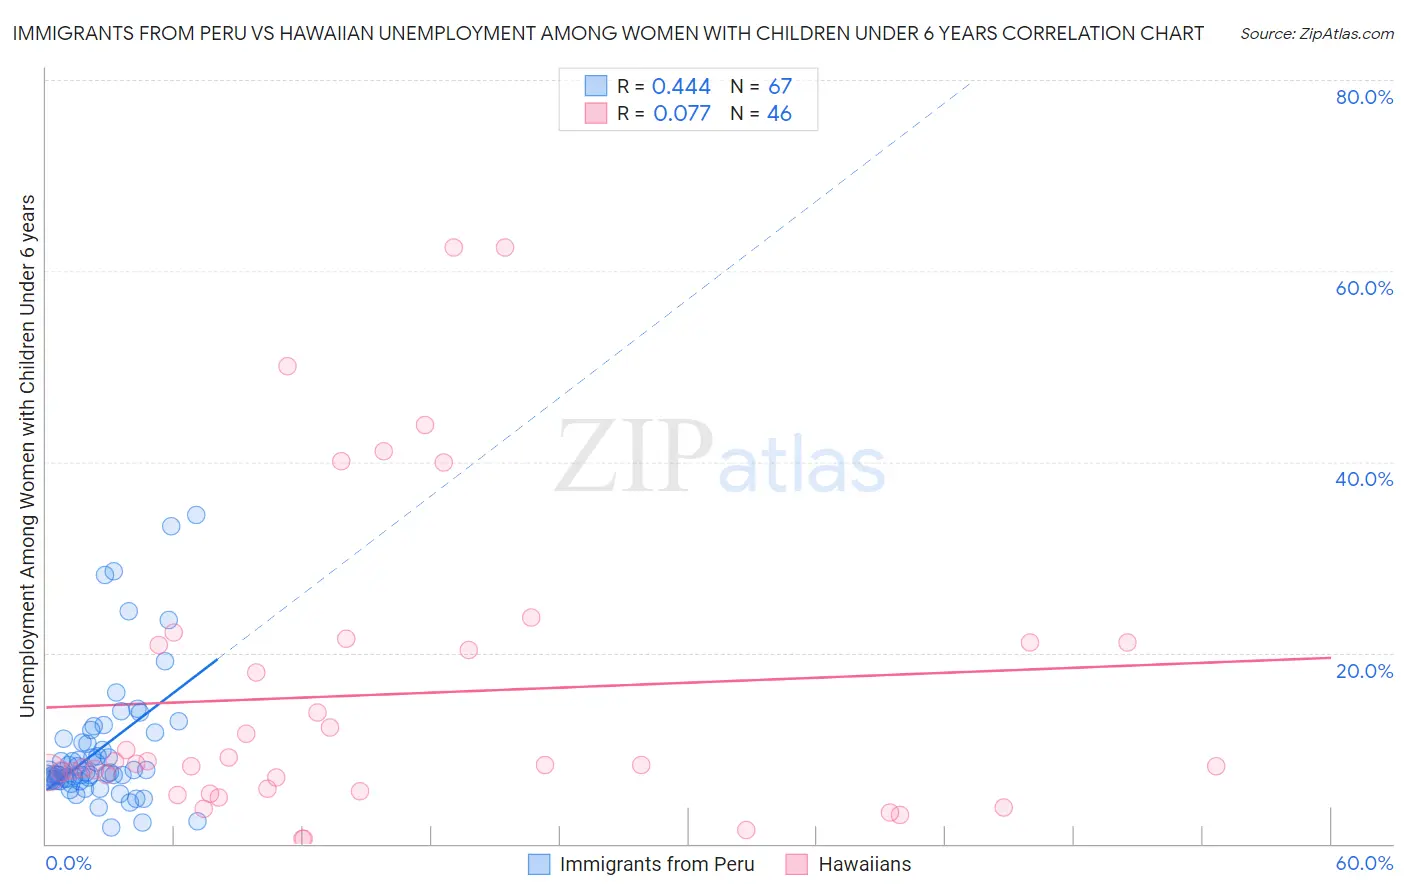
Immigrants from Peru vs Hawaiian Unemployment Among Women with Children Under 6 years Correlation Chart

The statistical analysis conducted on geographies consisting of 264,130,513 people shows a moderate positive correlation between the proportion of Immigrants from Peru and unemployment rate among women with children under the age of 6 in the United States with a correlation coefficient (R) of 0.444 and weighted average of 7.5%. Similarly, the statistical analysis conducted on geographies consisting of 261,346,546 people shows a slight positive correlation between the proportion of Hawaiians and unemployment rate among women with children under the age of 6 in the United States with a correlation coefficient (R) of 0.077 and weighted average of 8.2%, a difference of 8.6%.
Immigrants from Peru vs Hawaiian Unemployment Among Women with Children Under 6 years

Unemployment Among Women with Children Under 6 years Correlation Summary

MeasurementImmigrants from PeruHawaiian
Minimum1.7%0.50%
Maximum34.5%62.5%
Range32.8%62.0%
Mean9.9%15.6%
Median7.5%8.3%
Interquartile 25% (IQ1)6.7%5.8%
Interquartile 75% (IQ3)11.0%21.1%
Interquartile Range (IQR)4.3%15.3%
Standard Deviation (Sample)6.8%15.8%
Standard Deviation (Population)6.7%15.6%

Similar Demographics by Unemployment Among Women with Children Under 6 years

Demographics Similar to Immigrants from Peru by Unemployment Among Women with Children Under 6 years

In terms of unemployment among women with children under 6 years, the demographic groups most similar to Immigrants from Peru are Bangladeshi (7.5%, a difference of 0.010%), Uruguayan (7.5%, a difference of 0.020%), Northern European (7.5%, a difference of 0.050%), South American (7.5%, a difference of 0.070%), and Aleut (7.5%, a difference of 0.10%).
DemographicsRating | RankUnemployment Among Women with Children Under 6 years
Europeans
79.1
/100
|
#144
Good
7.5%
Immigrants | Jordan
78.9
/100
|
#145
Good
7.5%
Japanese
78.9
/100
|
#146
Good
7.5%
Immigrants | Oceania
78.4
/100
|
#147
Good
7.5%
Immigrants | Brazil
77.3
/100
|
#148
Good
7.5%
Colombians
76.1
/100
|
#149
Good
7.5%
Aleuts
76.0
/100
|
#150
Good
7.5%
Immigrants | Peru
74.9
/100
|
#151
Good
7.5%
Bangladeshis
74.8
/100
|
#152
Good
7.5%
Uruguayans
74.7
/100
|
#153
Good
7.5%
Northern Europeans
74.3
/100
|
#154
Good
7.5%
South Americans
74.1
/100
|
#155
Good
7.5%
Immigrants | Southern Europe
73.2
/100
|
#156
Good
7.5%
Peruvians
72.3
/100
|
#157
Good
7.5%
Croatians
71.9
/100
|
#158
Good
7.5%

Demographics Similar to Hawaiians by Unemployment Among Women with Children Under 6 years

In terms of unemployment among women with children under 6 years, the demographic groups most similar to Hawaiians are French (8.2%, a difference of 0.030%), Native Hawaiian (8.2%, a difference of 0.040%), Central American (8.2%, a difference of 0.37%), Dutch (8.1%, a difference of 0.56%), and Liberian (8.1%, a difference of 0.61%).
DemographicsRating | RankUnemployment Among Women with Children Under 6 years
Immigrants | Barbados
4.2
/100
|
#236
Tragic
8.0%
Immigrants | Costa Rica
4.1
/100
|
#237
Tragic
8.0%
Immigrants | Middle Africa
3.2
/100
|
#238
Tragic
8.1%
Irish
2.7
/100
|
#239
Tragic
8.1%
Immigrants | El Salvador
2.6
/100
|
#240
Tragic
8.1%
Liberians
2.6
/100
|
#241
Tragic
8.1%
Dutch
2.5
/100
|
#242
Tragic
8.1%
Hawaiians
1.8
/100
|
#243
Tragic
8.2%
French
1.7
/100
|
#244
Tragic
8.2%
Native Hawaiians
1.7
/100
|
#245
Tragic
8.2%
Central Americans
1.4
/100
|
#246
Tragic
8.2%
German Russians
1.2
/100
|
#247
Tragic
8.2%
Immigrants | Western Africa
1.1
/100
|
#248
Tragic
8.2%
Immigrants | Sierra Leone
1.1
/100
|
#249
Tragic
8.2%
Nigerians
1.1
/100
|
#250
Tragic
8.2%