Portuguese vs Hungarian Unemployment Among Women with Children Under 18 years
COMPARE
Portuguese
Hungarian
Unemployment Among Women with Children Under 18 years
Unemployment Among Women with Children Under 18 years Comparison
Portuguese
Hungarians
5.6%
UNEMPLOYMENT AMONG WOMEN WITH CHILDREN UNDER 18 YEARS
15.9/ 100
METRIC RATING
203rd/ 347
METRIC RANK
5.3%
UNEMPLOYMENT AMONG WOMEN WITH CHILDREN UNDER 18 YEARS
88.1/ 100
METRIC RATING
115th/ 347
METRIC RANK
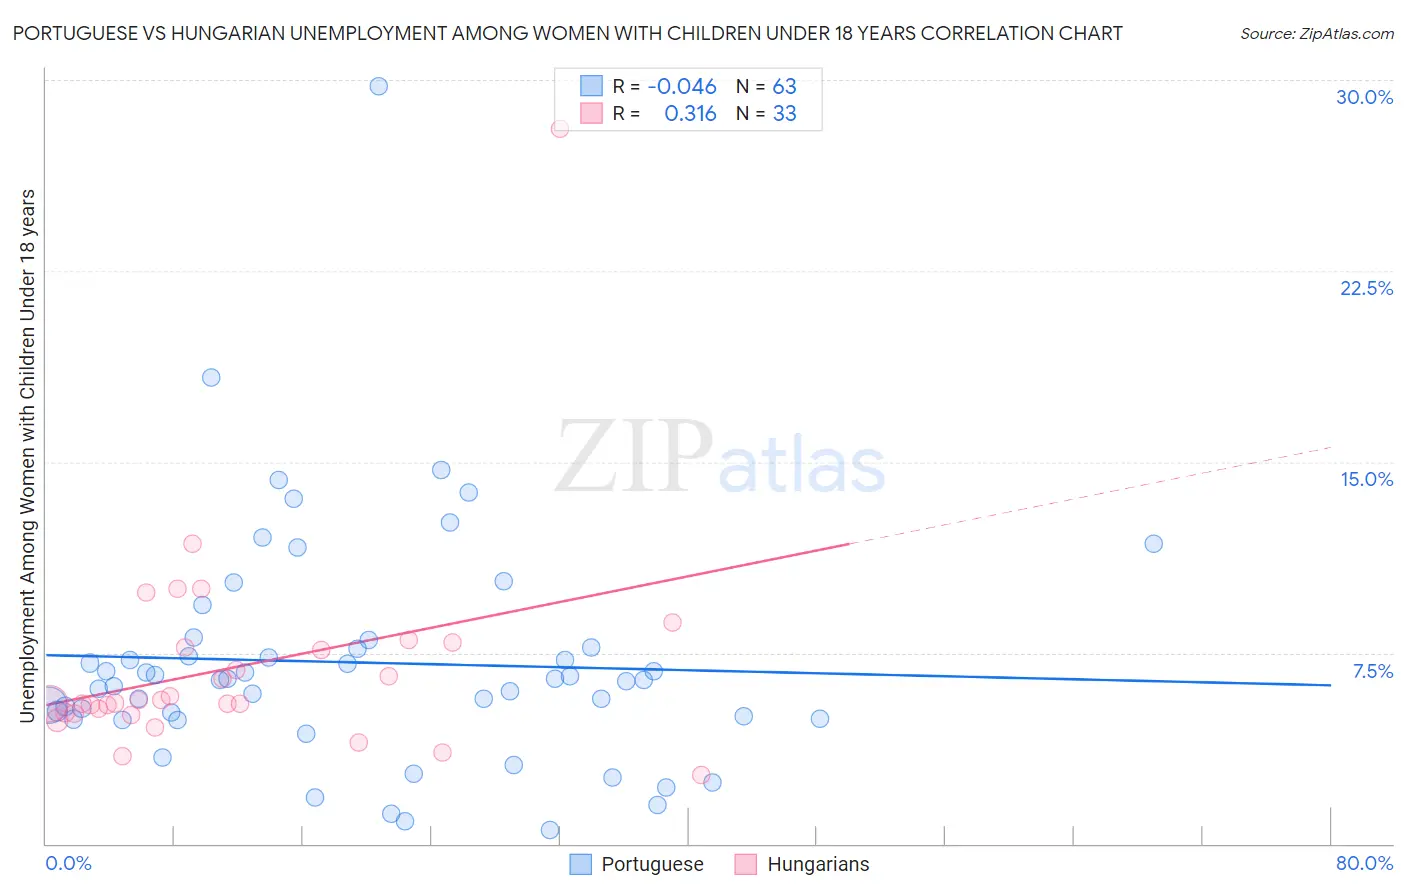
Portuguese vs Hungarian Unemployment Among Women with Children Under 18 years Correlation Chart
The statistical analysis conducted on geographies consisting of 426,366,108 people shows no correlation between the proportion of Portuguese and unemployment rate among women with children under the age of 18 in the United States with a correlation coefficient (R) of -0.046 and weighted average of 5.6%. Similarly, the statistical analysis conducted on geographies consisting of 453,794,407 people shows a mild positive correlation between the proportion of Hungarians and unemployment rate among women with children under the age of 18 in the United States with a correlation coefficient (R) of 0.316 and weighted average of 5.3%, a difference of 6.8%.
Unemployment Among Women with Children Under 18 years Correlation Summary
| Measurement | Portuguese | Hungarian |
| Minimum | 0.54% | 2.7% |
| Maximum | 29.7% | 28.1% |
| Range | 29.2% | 25.4% |
| Mean | 7.1% | 6.9% |
| Median | 6.4% | 5.5% |
| Interquartile 25% (IQ1) | 4.9% | 5.1% |
| Interquartile 75% (IQ3) | 7.7% | 7.8% |
| Interquartile Range (IQR) | 2.8% | 2.7% |
| Standard Deviation (Sample) | 4.6% | 4.3% |
| Standard Deviation (Population) | 4.6% | 4.3% |
Similar Demographics by Unemployment Among Women with Children Under 18 years
Demographics Similar to Portuguese by Unemployment Among Women with Children Under 18 years
In terms of unemployment among women with children under 18 years, the demographic groups most similar to Portuguese are Israeli (5.6%, a difference of 0.030%), Tsimshian (5.6%, a difference of 0.080%), Immigrants from Micronesia (5.6%, a difference of 0.15%), Immigrants from Morocco (5.6%, a difference of 0.24%), and Menominee (5.6%, a difference of 0.33%).
| Demographics | Rating | Rank | Unemployment Among Women with Children Under 18 years |
| Spaniards | 22.8 /100 | #196 | Fair 5.6% |
| Immigrants | Colombia | 21.4 /100 | #197 | Fair 5.6% |
| Arabs | 21.4 /100 | #198 | Fair 5.6% |
| Marshallese | 20.2 /100 | #199 | Fair 5.6% |
| Menominee | 18.6 /100 | #200 | Poor 5.6% |
| Immigrants | Morocco | 17.9 /100 | #201 | Poor 5.6% |
| Immigrants | Micronesia | 17.1 /100 | #202 | Poor 5.6% |
| Portuguese | 15.9 /100 | #203 | Poor 5.6% |
| Israelis | 15.6 /100 | #204 | Poor 5.6% |
| Tsimshian | 15.2 /100 | #205 | Poor 5.6% |
| Nicaraguans | 12.3 /100 | #206 | Poor 5.6% |
| Peruvians | 12.1 /100 | #207 | Poor 5.6% |
| Immigrants | Costa Rica | 11.6 /100 | #208 | Poor 5.6% |
| Immigrants | Western Asia | 11.3 /100 | #209 | Poor 5.6% |
| Immigrants | Nonimmigrants | 10.6 /100 | #210 | Poor 5.7% |
Demographics Similar to Hungarians by Unemployment Among Women with Children Under 18 years
In terms of unemployment among women with children under 18 years, the demographic groups most similar to Hungarians are Kenyan (5.3%, a difference of 0.010%), French (5.2%, a difference of 0.050%), Immigrants from Eastern Europe (5.2%, a difference of 0.070%), Macedonian (5.3%, a difference of 0.070%), and Canadian (5.3%, a difference of 0.13%).
| Demographics | Rating | Rank | Unemployment Among Women with Children Under 18 years |
| Iranians | 89.7 /100 | #108 | Excellent 5.2% |
| Immigrants | Russia | 89.0 /100 | #109 | Excellent 5.2% |
| Immigrants | Czechoslovakia | 88.9 /100 | #110 | Excellent 5.2% |
| French Canadians | 88.9 /100 | #111 | Excellent 5.2% |
| Immigrants | Eastern Europe | 88.5 /100 | #112 | Excellent 5.2% |
| French | 88.4 /100 | #113 | Excellent 5.2% |
| Kenyans | 88.2 /100 | #114 | Excellent 5.3% |
| Hungarians | 88.1 /100 | #115 | Excellent 5.3% |
| Macedonians | 87.7 /100 | #116 | Excellent 5.3% |
| Canadians | 87.4 /100 | #117 | Excellent 5.3% |
| Immigrants | Europe | 86.7 /100 | #118 | Excellent 5.3% |
| Basques | 86.5 /100 | #119 | Excellent 5.3% |
| Egyptians | 86.4 /100 | #120 | Excellent 5.3% |
| Immigrants | Romania | 85.8 /100 | #121 | Excellent 5.3% |
| Scotch-Irish | 85.7 /100 | #122 | Excellent 5.3% |