Portuguese vs Immigrants from Bahamas Unemployment Among Women with Children Under 18 years
COMPARE
Portuguese
Immigrants from Bahamas
Unemployment Among Women with Children Under 18 years
Unemployment Among Women with Children Under 18 years Comparison
Portuguese
Immigrants from Bahamas
5.6%
UNEMPLOYMENT AMONG WOMEN WITH CHILDREN UNDER 18 YEARS
15.9/ 100
METRIC RATING
203rd/ 347
METRIC RANK
6.1%
UNEMPLOYMENT AMONG WOMEN WITH CHILDREN UNDER 18 YEARS
0.1/ 100
METRIC RATING
265th/ 347
METRIC RANK
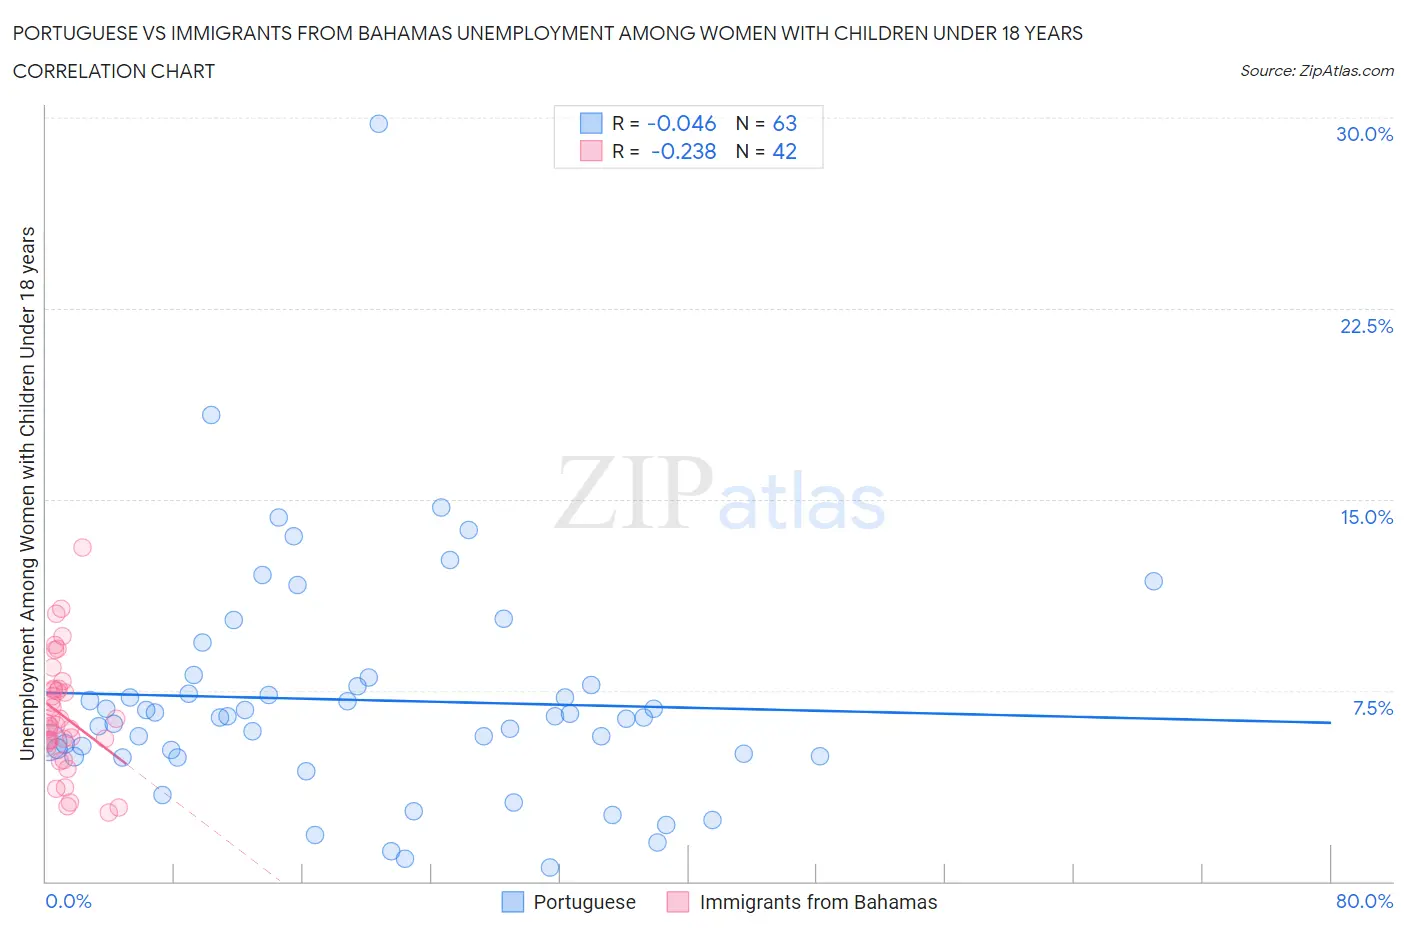
Portuguese vs Immigrants from Bahamas Unemployment Among Women with Children Under 18 years Correlation Chart
The statistical analysis conducted on geographies consisting of 426,366,108 people shows no correlation between the proportion of Portuguese and unemployment rate among women with children under the age of 18 in the United States with a correlation coefficient (R) of -0.046 and weighted average of 5.6%. Similarly, the statistical analysis conducted on geographies consisting of 103,539,940 people shows a weak negative correlation between the proportion of Immigrants from Bahamas and unemployment rate among women with children under the age of 18 in the United States with a correlation coefficient (R) of -0.238 and weighted average of 6.1%, a difference of 9.7%.
Unemployment Among Women with Children Under 18 years Correlation Summary
| Measurement | Portuguese | Immigrants from Bahamas |
| Minimum | 0.54% | 2.7% |
| Maximum | 29.7% | 13.1% |
| Range | 29.2% | 10.4% |
| Mean | 7.1% | 6.5% |
| Median | 6.4% | 6.1% |
| Interquartile 25% (IQ1) | 4.9% | 5.4% |
| Interquartile 75% (IQ3) | 7.7% | 7.6% |
| Interquartile Range (IQR) | 2.8% | 2.1% |
| Standard Deviation (Sample) | 4.6% | 2.2% |
| Standard Deviation (Population) | 4.6% | 2.2% |
Similar Demographics by Unemployment Among Women with Children Under 18 years
Demographics Similar to Portuguese by Unemployment Among Women with Children Under 18 years
In terms of unemployment among women with children under 18 years, the demographic groups most similar to Portuguese are Israeli (5.6%, a difference of 0.030%), Tsimshian (5.6%, a difference of 0.080%), Immigrants from Micronesia (5.6%, a difference of 0.15%), Immigrants from Morocco (5.6%, a difference of 0.24%), and Menominee (5.6%, a difference of 0.33%).
| Demographics | Rating | Rank | Unemployment Among Women with Children Under 18 years |
| Spaniards | 22.8 /100 | #196 | Fair 5.6% |
| Immigrants | Colombia | 21.4 /100 | #197 | Fair 5.6% |
| Arabs | 21.4 /100 | #198 | Fair 5.6% |
| Marshallese | 20.2 /100 | #199 | Fair 5.6% |
| Menominee | 18.6 /100 | #200 | Poor 5.6% |
| Immigrants | Morocco | 17.9 /100 | #201 | Poor 5.6% |
| Immigrants | Micronesia | 17.1 /100 | #202 | Poor 5.6% |
| Portuguese | 15.9 /100 | #203 | Poor 5.6% |
| Israelis | 15.6 /100 | #204 | Poor 5.6% |
| Tsimshian | 15.2 /100 | #205 | Poor 5.6% |
| Nicaraguans | 12.3 /100 | #206 | Poor 5.6% |
| Peruvians | 12.1 /100 | #207 | Poor 5.6% |
| Immigrants | Costa Rica | 11.6 /100 | #208 | Poor 5.6% |
| Immigrants | Western Asia | 11.3 /100 | #209 | Poor 5.6% |
| Immigrants | Nonimmigrants | 10.6 /100 | #210 | Poor 5.7% |
Demographics Similar to Immigrants from Bahamas by Unemployment Among Women with Children Under 18 years
In terms of unemployment among women with children under 18 years, the demographic groups most similar to Immigrants from Bahamas are Comanche (6.1%, a difference of 0.16%), Spanish American Indian (6.1%, a difference of 0.23%), Immigrants from Liberia (6.1%, a difference of 0.25%), Immigrants from Trinidad and Tobago (6.1%, a difference of 0.25%), and Subsaharan African (6.2%, a difference of 0.33%).
| Demographics | Rating | Rank | Unemployment Among Women with Children Under 18 years |
| Immigrants | Nigeria | 0.1 /100 | #258 | Tragic 6.1% |
| Ottawa | 0.1 /100 | #259 | Tragic 6.1% |
| Nigerians | 0.1 /100 | #260 | Tragic 6.1% |
| Immigrants | Liberia | 0.1 /100 | #261 | Tragic 6.1% |
| Immigrants | Trinidad and Tobago | 0.1 /100 | #262 | Tragic 6.1% |
| Spanish American Indians | 0.1 /100 | #263 | Tragic 6.1% |
| Comanche | 0.1 /100 | #264 | Tragic 6.1% |
| Immigrants | Bahamas | 0.1 /100 | #265 | Tragic 6.1% |
| Sub-Saharan Africans | 0.1 /100 | #266 | Tragic 6.2% |
| French American Indians | 0.1 /100 | #267 | Tragic 6.2% |
| Trinidadians and Tobagonians | 0.1 /100 | #268 | Tragic 6.2% |
| Cajuns | 0.1 /100 | #269 | Tragic 6.2% |
| Ghanaians | 0.1 /100 | #270 | Tragic 6.2% |
| Central Americans | 0.0 /100 | #271 | Tragic 6.2% |
| Salvadorans | 0.0 /100 | #272 | Tragic 6.2% |