Dominican vs Hispanic or Latino Unemployment Among Women with Children Under 18 years
COMPARE
Dominican
Hispanic or Latino
Unemployment Among Women with Children Under 18 years
Unemployment Among Women with Children Under 18 years Comparison
Dominicans
Hispanics or Latinos
7.5%
UNEMPLOYMENT AMONG WOMEN WITH CHILDREN UNDER 18 YEARS
0.0/ 100
METRIC RATING
332nd/ 347
METRIC RANK
6.6%
UNEMPLOYMENT AMONG WOMEN WITH CHILDREN UNDER 18 YEARS
0.0/ 100
METRIC RATING
313th/ 347
METRIC RANK
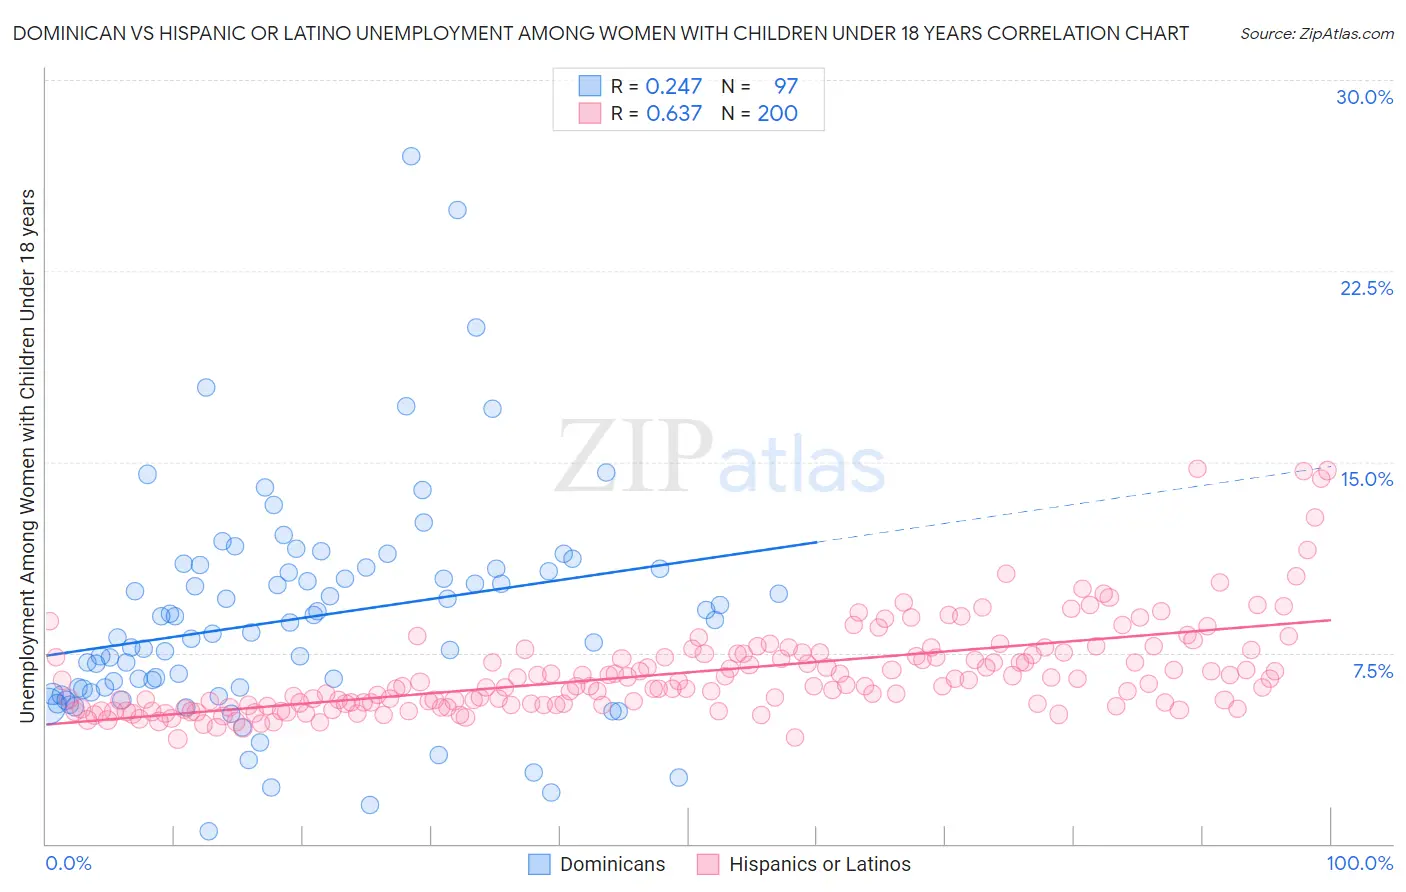
Dominican vs Hispanic or Latino Unemployment Among Women with Children Under 18 years Correlation Chart
The statistical analysis conducted on geographies consisting of 343,360,704 people shows a weak positive correlation between the proportion of Dominicans and unemployment rate among women with children under the age of 18 in the United States with a correlation coefficient (R) of 0.247 and weighted average of 7.5%. Similarly, the statistical analysis conducted on geographies consisting of 521,591,164 people shows a significant positive correlation between the proportion of Hispanics or Latinos and unemployment rate among women with children under the age of 18 in the United States with a correlation coefficient (R) of 0.637 and weighted average of 6.6%, a difference of 13.1%.
Unemployment Among Women with Children Under 18 years Correlation Summary
| Measurement | Dominican | Hispanic or Latino |
| Minimum | 0.50% | 4.1% |
| Maximum | 27.0% | 14.7% |
| Range | 26.5% | 10.6% |
| Mean | 8.9% | 6.7% |
| Median | 8.3% | 6.2% |
| Interquartile 25% (IQ1) | 6.0% | 5.4% |
| Interquartile 75% (IQ3) | 10.8% | 7.5% |
| Interquartile Range (IQR) | 4.8% | 2.0% |
| Standard Deviation (Sample) | 4.4% | 1.9% |
| Standard Deviation (Population) | 4.3% | 1.9% |
Demographics Similar to Dominicans and Hispanics or Latinos by Unemployment Among Women with Children Under 18 years
In terms of unemployment among women with children under 18 years, the demographic groups most similar to Dominicans are Hopi (7.4%, a difference of 0.54%), Colville (7.4%, a difference of 1.1%), Black/African American (7.3%, a difference of 2.6%), Native/Alaskan (7.2%, a difference of 3.0%), and Lumbee (7.1%, a difference of 5.4%). Similarly, the demographic groups most similar to Hispanics or Latinos are British West Indian (6.6%, a difference of 0.14%), Immigrants from West Indies (6.6%, a difference of 0.14%), Immigrants from Mexico (6.6%, a difference of 0.29%), Immigrants from Ecuador (6.6%, a difference of 0.48%), and Shoshone (6.6%, a difference of 0.52%).
| Demographics | Rating | Rank | Unemployment Among Women with Children Under 18 years |
| Immigrants | Mexico | 0.0 /100 | #312 | Tragic 6.6% |
| Hispanics or Latinos | 0.0 /100 | #313 | Tragic 6.6% |
| British West Indians | 0.0 /100 | #314 | Tragic 6.6% |
| Immigrants | West Indies | 0.0 /100 | #315 | Tragic 6.6% |
| Immigrants | Ecuador | 0.0 /100 | #316 | Tragic 6.6% |
| Shoshone | 0.0 /100 | #317 | Tragic 6.6% |
| Alaska Natives | 0.0 /100 | #318 | Tragic 6.7% |
| Central American Indians | 0.0 /100 | #319 | Tragic 6.7% |
| Immigrants | Belize | 0.0 /100 | #320 | Tragic 6.7% |
| U.S. Virgin Islanders | 0.0 /100 | #321 | Tragic 6.7% |
| Houma | 0.0 /100 | #322 | Tragic 6.8% |
| Pueblo | 0.0 /100 | #323 | Tragic 6.8% |
| Paiute | 0.0 /100 | #324 | Tragic 6.9% |
| Immigrants | Dominica | 0.0 /100 | #325 | Tragic 7.0% |
| Chippewa | 0.0 /100 | #326 | Tragic 7.0% |
| Lumbee | 0.0 /100 | #327 | Tragic 7.1% |
| Natives/Alaskans | 0.0 /100 | #328 | Tragic 7.2% |
| Blacks/African Americans | 0.0 /100 | #329 | Tragic 7.3% |
| Colville | 0.0 /100 | #330 | Tragic 7.4% |
| Hopi | 0.0 /100 | #331 | Tragic 7.4% |
| Dominicans | 0.0 /100 | #332 | Tragic 7.5% |