Polish vs French Unemployment Among Women with Children Under 6 years
COMPARE
Polish
French
Unemployment Among Women with Children Under 6 years
Unemployment Among Women with Children Under 6 years Comparison
Poles
French
7.9%
UNEMPLOYMENT AMONG WOMEN WITH CHILDREN UNDER 6 YEARS
16.0/ 100
METRIC RATING
210th/ 347
METRIC RANK
8.2%
UNEMPLOYMENT AMONG WOMEN WITH CHILDREN UNDER 6 YEARS
1.7/ 100
METRIC RATING
244th/ 347
METRIC RANK
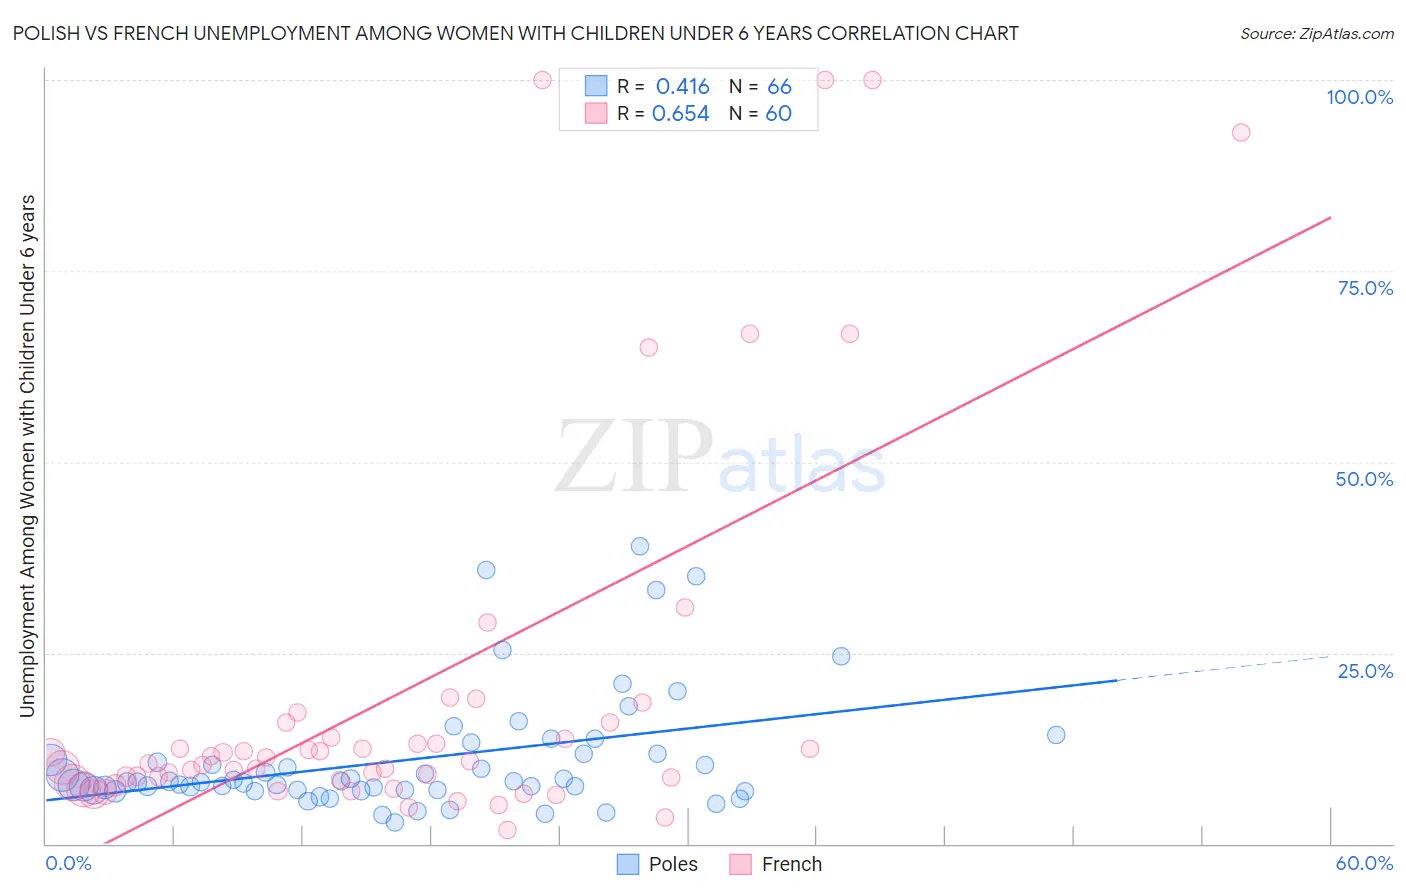
Polish vs French Unemployment Among Women with Children Under 6 years Correlation Chart
The statistical analysis conducted on geographies consisting of 372,625,491 people shows a moderate positive correlation between the proportion of Poles and unemployment rate among women with children under the age of 6 in the United States with a correlation coefficient (R) of 0.416 and weighted average of 7.9%. Similarly, the statistical analysis conducted on geographies consisting of 377,570,296 people shows a significant positive correlation between the proportion of French and unemployment rate among women with children under the age of 6 in the United States with a correlation coefficient (R) of 0.654 and weighted average of 8.2%, a difference of 3.8%.
Unemployment Among Women with Children Under 6 years Correlation Summary
| Measurement | Polish | French |
| Minimum | 2.8% | 1.8% |
| Maximum | 38.9% | 100.0% |
| Range | 36.0% | 98.2% |
| Mean | 11.0% | 19.6% |
| Median | 8.0% | 10.7% |
| Interquartile 25% (IQ1) | 7.1% | 8.1% |
| Interquartile 75% (IQ3) | 11.8% | 14.9% |
| Interquartile Range (IQR) | 4.7% | 6.8% |
| Standard Deviation (Sample) | 7.8% | 24.9% |
| Standard Deviation (Population) | 7.7% | 24.7% |
Similar Demographics by Unemployment Among Women with Children Under 6 years
Demographics Similar to Poles by Unemployment Among Women with Children Under 6 years
In terms of unemployment among women with children under 6 years, the demographic groups most similar to Poles are Immigrants from Ecuador (7.9%, a difference of 0.13%), Costa Rican (7.8%, a difference of 0.18%), Immigrants from Syria (7.8%, a difference of 0.32%), Canadian (7.8%, a difference of 0.50%), and Swiss (7.9%, a difference of 0.50%).
| Demographics | Rating | Rank | Unemployment Among Women with Children Under 6 years |
| Spaniards | 23.3 /100 | #203 | Fair 7.8% |
| Lebanese | 22.2 /100 | #204 | Fair 7.8% |
| Immigrants | Immigrants | 21.4 /100 | #205 | Fair 7.8% |
| Hungarians | 21.2 /100 | #206 | Fair 7.8% |
| Canadians | 20.6 /100 | #207 | Fair 7.8% |
| Immigrants | Syria | 18.9 /100 | #208 | Poor 7.8% |
| Costa Ricans | 17.6 /100 | #209 | Poor 7.8% |
| Poles | 16.0 /100 | #210 | Poor 7.9% |
| Immigrants | Ecuador | 14.9 /100 | #211 | Poor 7.9% |
| Swiss | 12.3 /100 | #212 | Poor 7.9% |
| Scottish | 11.4 /100 | #213 | Poor 7.9% |
| Spanish | 11.3 /100 | #214 | Poor 7.9% |
| Ecuadorians | 11.2 /100 | #215 | Poor 7.9% |
| Immigrants | Lebanon | 11.1 /100 | #216 | Poor 7.9% |
| Immigrants | Nigeria | 10.3 /100 | #217 | Poor 7.9% |
Demographics Similar to French by Unemployment Among Women with Children Under 6 years
In terms of unemployment among women with children under 6 years, the demographic groups most similar to French are Native Hawaiian (8.2%, a difference of 0.010%), Hawaiian (8.2%, a difference of 0.030%), Central American (8.2%, a difference of 0.34%), Dutch (8.1%, a difference of 0.59%), and German Russian (8.2%, a difference of 0.61%).
| Demographics | Rating | Rank | Unemployment Among Women with Children Under 6 years |
| Immigrants | Costa Rica | 4.1 /100 | #237 | Tragic 8.0% |
| Immigrants | Middle Africa | 3.2 /100 | #238 | Tragic 8.1% |
| Irish | 2.7 /100 | #239 | Tragic 8.1% |
| Immigrants | El Salvador | 2.6 /100 | #240 | Tragic 8.1% |
| Liberians | 2.6 /100 | #241 | Tragic 8.1% |
| Dutch | 2.5 /100 | #242 | Tragic 8.1% |
| Hawaiians | 1.8 /100 | #243 | Tragic 8.2% |
| French | 1.7 /100 | #244 | Tragic 8.2% |
| Native Hawaiians | 1.7 /100 | #245 | Tragic 8.2% |
| Central Americans | 1.4 /100 | #246 | Tragic 8.2% |
| German Russians | 1.2 /100 | #247 | Tragic 8.2% |
| Immigrants | Western Africa | 1.1 /100 | #248 | Tragic 8.2% |
| Immigrants | Sierra Leone | 1.1 /100 | #249 | Tragic 8.2% |
| Nigerians | 1.1 /100 | #250 | Tragic 8.2% |
| Guyanese | 1.0 /100 | #251 | Tragic 8.2% |