Sri Lankan vs French Unemployment Among Women with Children Under 6 years
COMPARE
Sri Lankan
French
Unemployment Among Women with Children Under 6 years
Unemployment Among Women with Children Under 6 years Comparison
Sri Lankans
French
6.6%
UNEMPLOYMENT AMONG WOMEN WITH CHILDREN UNDER 6 YEARS
100.0/ 100
METRIC RATING
37th/ 347
METRIC RANK
8.2%
UNEMPLOYMENT AMONG WOMEN WITH CHILDREN UNDER 6 YEARS
1.7/ 100
METRIC RATING
244th/ 347
METRIC RANK
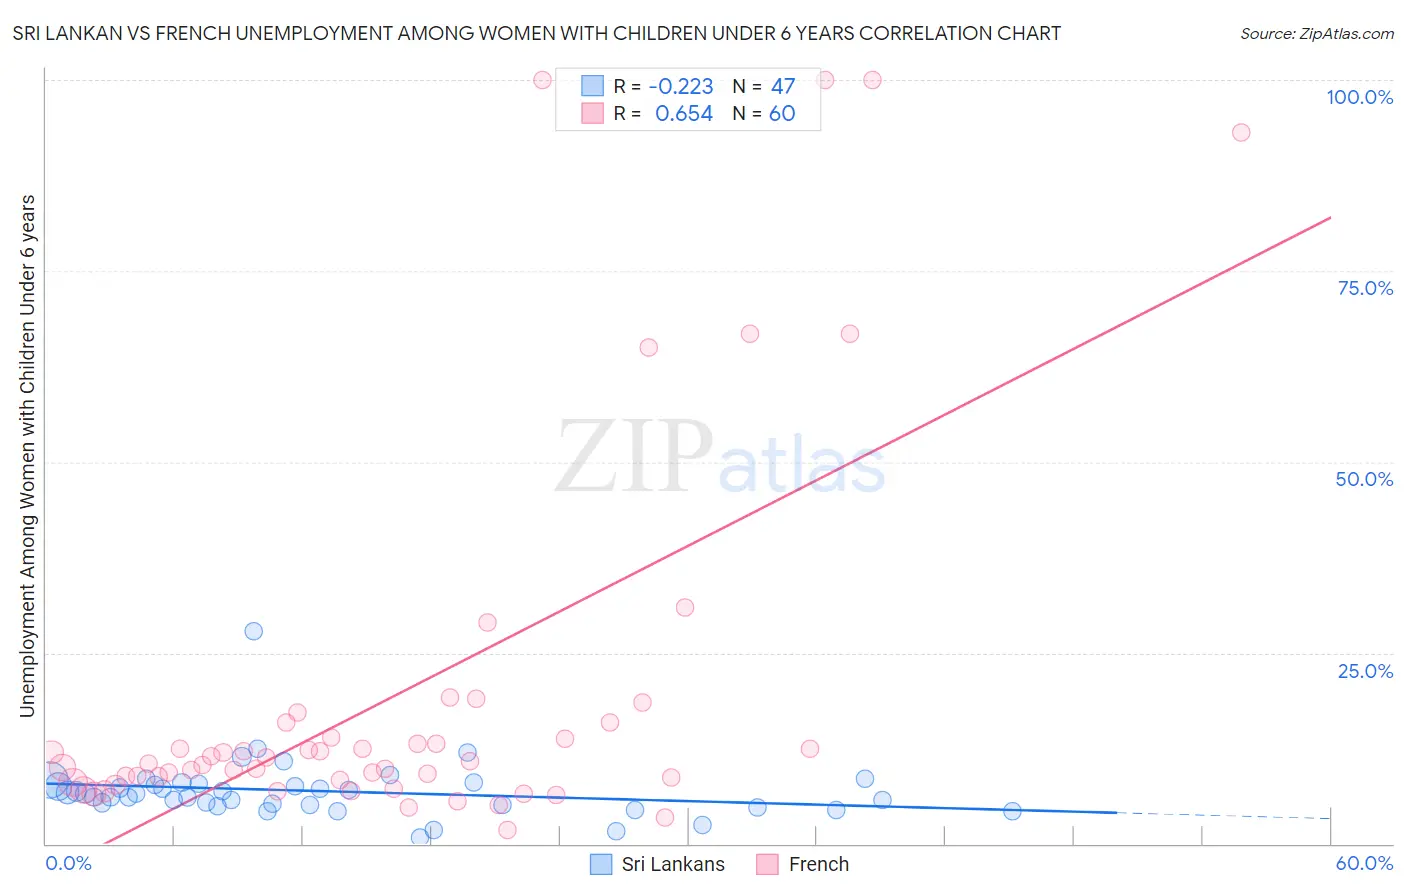
Sri Lankan vs French Unemployment Among Women with Children Under 6 years Correlation Chart
The statistical analysis conducted on geographies consisting of 330,167,868 people shows a weak negative correlation between the proportion of Sri Lankans and unemployment rate among women with children under the age of 6 in the United States with a correlation coefficient (R) of -0.223 and weighted average of 6.6%. Similarly, the statistical analysis conducted on geographies consisting of 377,570,296 people shows a significant positive correlation between the proportion of French and unemployment rate among women with children under the age of 6 in the United States with a correlation coefficient (R) of 0.654 and weighted average of 8.2%, a difference of 22.7%.
Unemployment Among Women with Children Under 6 years Correlation Summary
| Measurement | Sri Lankan | French |
| Minimum | 0.90% | 1.8% |
| Maximum | 27.8% | 100.0% |
| Range | 26.9% | 98.2% |
| Mean | 6.9% | 19.6% |
| Median | 6.5% | 10.7% |
| Interquartile 25% (IQ1) | 5.0% | 8.1% |
| Interquartile 75% (IQ3) | 7.9% | 14.9% |
| Interquartile Range (IQR) | 2.9% | 6.8% |
| Standard Deviation (Sample) | 3.9% | 24.9% |
| Standard Deviation (Population) | 3.9% | 24.7% |
Similar Demographics by Unemployment Among Women with Children Under 6 years
Demographics Similar to Sri Lankans by Unemployment Among Women with Children Under 6 years
In terms of unemployment among women with children under 6 years, the demographic groups most similar to Sri Lankans are Hmong (6.7%, a difference of 0.13%), Immigrants from Russia (6.7%, a difference of 0.19%), Luxembourger (6.6%, a difference of 0.25%), Yakama (6.6%, a difference of 0.32%), and Asian (6.7%, a difference of 0.41%).
| Demographics | Rating | Rank | Unemployment Among Women with Children Under 6 years |
| Immigrants | Belarus | 100.0 /100 | #30 | Exceptional 6.6% |
| Immigrants | Moldova | 100.0 /100 | #31 | Exceptional 6.6% |
| Tsimshian | 100.0 /100 | #32 | Exceptional 6.6% |
| Immigrants | Vietnam | 100.0 /100 | #33 | Exceptional 6.6% |
| Immigrants | South Central Asia | 100.0 /100 | #34 | Exceptional 6.6% |
| Yakama | 100.0 /100 | #35 | Exceptional 6.6% |
| Luxembourgers | 100.0 /100 | #36 | Exceptional 6.6% |
| Sri Lankans | 100.0 /100 | #37 | Exceptional 6.6% |
| Hmong | 100.0 /100 | #38 | Exceptional 6.7% |
| Immigrants | Russia | 100.0 /100 | #39 | Exceptional 6.7% |
| Asians | 100.0 /100 | #40 | Exceptional 6.7% |
| Immigrants | Indonesia | 99.9 /100 | #41 | Exceptional 6.7% |
| Immigrants | Cuba | 99.9 /100 | #42 | Exceptional 6.7% |
| Bhutanese | 99.9 /100 | #43 | Exceptional 6.7% |
| Iranians | 99.9 /100 | #44 | Exceptional 6.7% |
Demographics Similar to French by Unemployment Among Women with Children Under 6 years
In terms of unemployment among women with children under 6 years, the demographic groups most similar to French are Native Hawaiian (8.2%, a difference of 0.010%), Hawaiian (8.2%, a difference of 0.030%), Central American (8.2%, a difference of 0.34%), Dutch (8.1%, a difference of 0.59%), and German Russian (8.2%, a difference of 0.61%).
| Demographics | Rating | Rank | Unemployment Among Women with Children Under 6 years |
| Immigrants | Costa Rica | 4.1 /100 | #237 | Tragic 8.0% |
| Immigrants | Middle Africa | 3.2 /100 | #238 | Tragic 8.1% |
| Irish | 2.7 /100 | #239 | Tragic 8.1% |
| Immigrants | El Salvador | 2.6 /100 | #240 | Tragic 8.1% |
| Liberians | 2.6 /100 | #241 | Tragic 8.1% |
| Dutch | 2.5 /100 | #242 | Tragic 8.1% |
| Hawaiians | 1.8 /100 | #243 | Tragic 8.2% |
| French | 1.7 /100 | #244 | Tragic 8.2% |
| Native Hawaiians | 1.7 /100 | #245 | Tragic 8.2% |
| Central Americans | 1.4 /100 | #246 | Tragic 8.2% |
| German Russians | 1.2 /100 | #247 | Tragic 8.2% |
| Immigrants | Western Africa | 1.1 /100 | #248 | Tragic 8.2% |
| Immigrants | Sierra Leone | 1.1 /100 | #249 | Tragic 8.2% |
| Nigerians | 1.1 /100 | #250 | Tragic 8.2% |
| Guyanese | 1.0 /100 | #251 | Tragic 8.2% |