Polish vs French Child Poverty Under the Age of 16
COMPARE
Polish
French
Child Poverty Under the Age of 16
Child Poverty Under the Age of 16 Comparison
Poles
French
14.0%
CHILD POVERTY UNDER THE AGE OF 16
98.9/ 100
METRIC RATING
52nd/ 347
METRIC RANK
15.6%
CHILD POVERTY UNDER THE AGE OF 16
78.5/ 100
METRIC RATING
151st/ 347
METRIC RANK
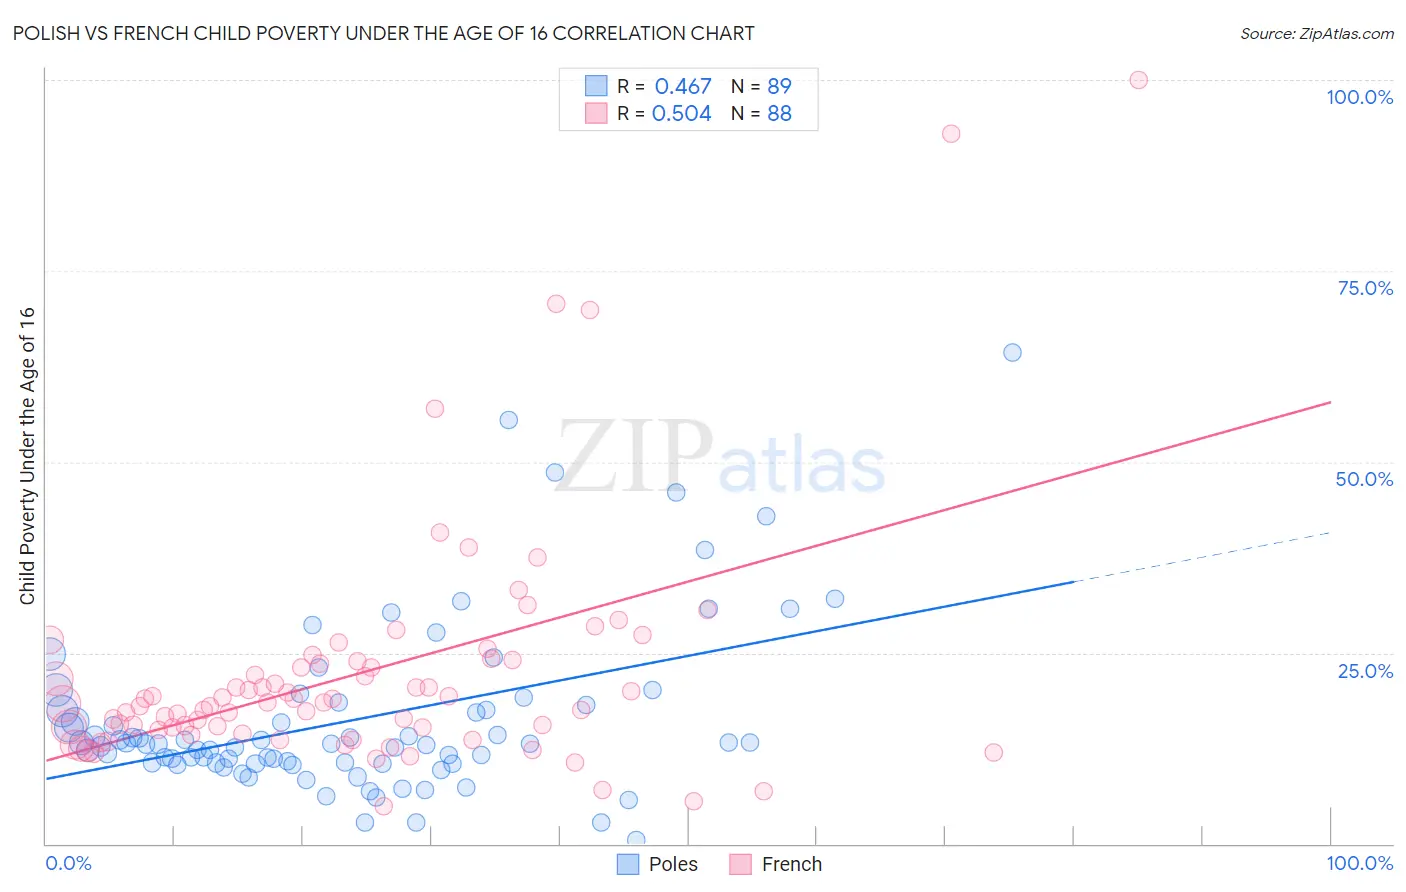
Polish vs French Child Poverty Under the Age of 16 Correlation Chart
The statistical analysis conducted on geographies consisting of 547,911,563 people shows a moderate positive correlation between the proportion of Poles and poverty level among children under the age of 16 in the United States with a correlation coefficient (R) of 0.467 and weighted average of 14.0%. Similarly, the statistical analysis conducted on geographies consisting of 559,388,012 people shows a substantial positive correlation between the proportion of French and poverty level among children under the age of 16 in the United States with a correlation coefficient (R) of 0.504 and weighted average of 15.6%, a difference of 11.0%.
Child Poverty Under the Age of 16 Correlation Summary
| Measurement | Polish | French |
| Minimum | 0.49% | 5.0% |
| Maximum | 64.3% | 100.0% |
| Range | 63.8% | 95.0% |
| Mean | 16.3% | 22.2% |
| Median | 13.1% | 18.4% |
| Interquartile 25% (IQ1) | 10.6% | 14.7% |
| Interquartile 75% (IQ3) | 17.8% | 23.7% |
| Interquartile Range (IQR) | 7.3% | 9.0% |
| Standard Deviation (Sample) | 11.2% | 15.8% |
| Standard Deviation (Population) | 11.2% | 15.7% |
Similar Demographics by Child Poverty Under the Age of 16
Demographics Similar to Poles by Child Poverty Under the Age of 16
In terms of child poverty under the age of 16, the demographic groups most similar to Poles are Immigrants from Israel (14.1%, a difference of 0.31%), Tsimshian (14.1%, a difference of 0.34%), Immigrants from Indonesia (14.1%, a difference of 0.40%), Immigrants from Serbia (14.1%, a difference of 0.58%), and Immigrants from Belgium (14.1%, a difference of 0.66%).
| Demographics | Rating | Rank | Child Poverty Under the Age of 16 |
| Czechs | 99.3 /100 | #45 | Exceptional 13.8% |
| Immigrants | Asia | 99.2 /100 | #46 | Exceptional 13.8% |
| Estonians | 99.2 /100 | #47 | Exceptional 13.9% |
| Koreans | 99.2 /100 | #48 | Exceptional 13.9% |
| Italians | 99.2 /100 | #49 | Exceptional 13.9% |
| Immigrants | Czechoslovakia | 99.1 /100 | #50 | Exceptional 13.9% |
| Immigrants | Greece | 99.1 /100 | #51 | Exceptional 13.9% |
| Poles | 98.9 /100 | #52 | Exceptional 14.0% |
| Immigrants | Israel | 98.8 /100 | #53 | Exceptional 14.1% |
| Tsimshian | 98.8 /100 | #54 | Exceptional 14.1% |
| Immigrants | Indonesia | 98.7 /100 | #55 | Exceptional 14.1% |
| Immigrants | Serbia | 98.7 /100 | #56 | Exceptional 14.1% |
| Immigrants | Belgium | 98.6 /100 | #57 | Exceptional 14.1% |
| Immigrants | Pakistan | 98.6 /100 | #58 | Exceptional 14.1% |
| Scandinavians | 98.6 /100 | #59 | Exceptional 14.1% |
Demographics Similar to French by Child Poverty Under the Age of 16
In terms of child poverty under the age of 16, the demographic groups most similar to French are Immigrants from Jordan (15.6%, a difference of 0.0%), French Canadian (15.6%, a difference of 0.040%), Venezuelan (15.6%, a difference of 0.18%), Samoan (15.6%, a difference of 0.22%), and Israeli (15.5%, a difference of 0.32%).
| Demographics | Rating | Rank | Child Poverty Under the Age of 16 |
| Immigrants | Hungary | 81.9 /100 | #144 | Excellent 15.5% |
| Immigrants | Peru | 81.7 /100 | #145 | Excellent 15.5% |
| Slovaks | 81.4 /100 | #146 | Excellent 15.5% |
| Immigrants | Kuwait | 80.5 /100 | #147 | Excellent 15.5% |
| Puget Sound Salish | 80.3 /100 | #148 | Excellent 15.5% |
| Israelis | 80.1 /100 | #149 | Excellent 15.5% |
| Immigrants | Jordan | 78.5 /100 | #150 | Good 15.6% |
| French | 78.5 /100 | #151 | Good 15.6% |
| French Canadians | 78.2 /100 | #152 | Good 15.6% |
| Venezuelans | 77.4 /100 | #153 | Good 15.6% |
| Samoans | 77.3 /100 | #154 | Good 15.6% |
| Syrians | 76.1 /100 | #155 | Good 15.6% |
| Immigrants | Venezuela | 74.9 /100 | #156 | Good 15.7% |
| Immigrants | Nepal | 72.9 /100 | #157 | Good 15.7% |
| Immigrants | Chile | 72.8 /100 | #158 | Good 15.7% |