Assyrian/Chaldean/Syriac vs Immigrants from Yemen Unemployment Among Ages 35 to 44 years
COMPARE
Assyrian/Chaldean/Syriac
Immigrants from Yemen
Unemployment Among Ages 35 to 44 years
Unemployment Among Ages 35 to 44 years Comparison
Assyrians/Chaldeans/Syriacs
Immigrants from Yemen
4.3%
UNEMPLOYMENT AMONG AGES 35 TO 44 YEARS
99.3/ 100
METRIC RATING
27th/ 347
METRIC RANK
6.6%
UNEMPLOYMENT AMONG AGES 35 TO 44 YEARS
0.0/ 100
METRIC RATING
325th/ 347
METRIC RANK
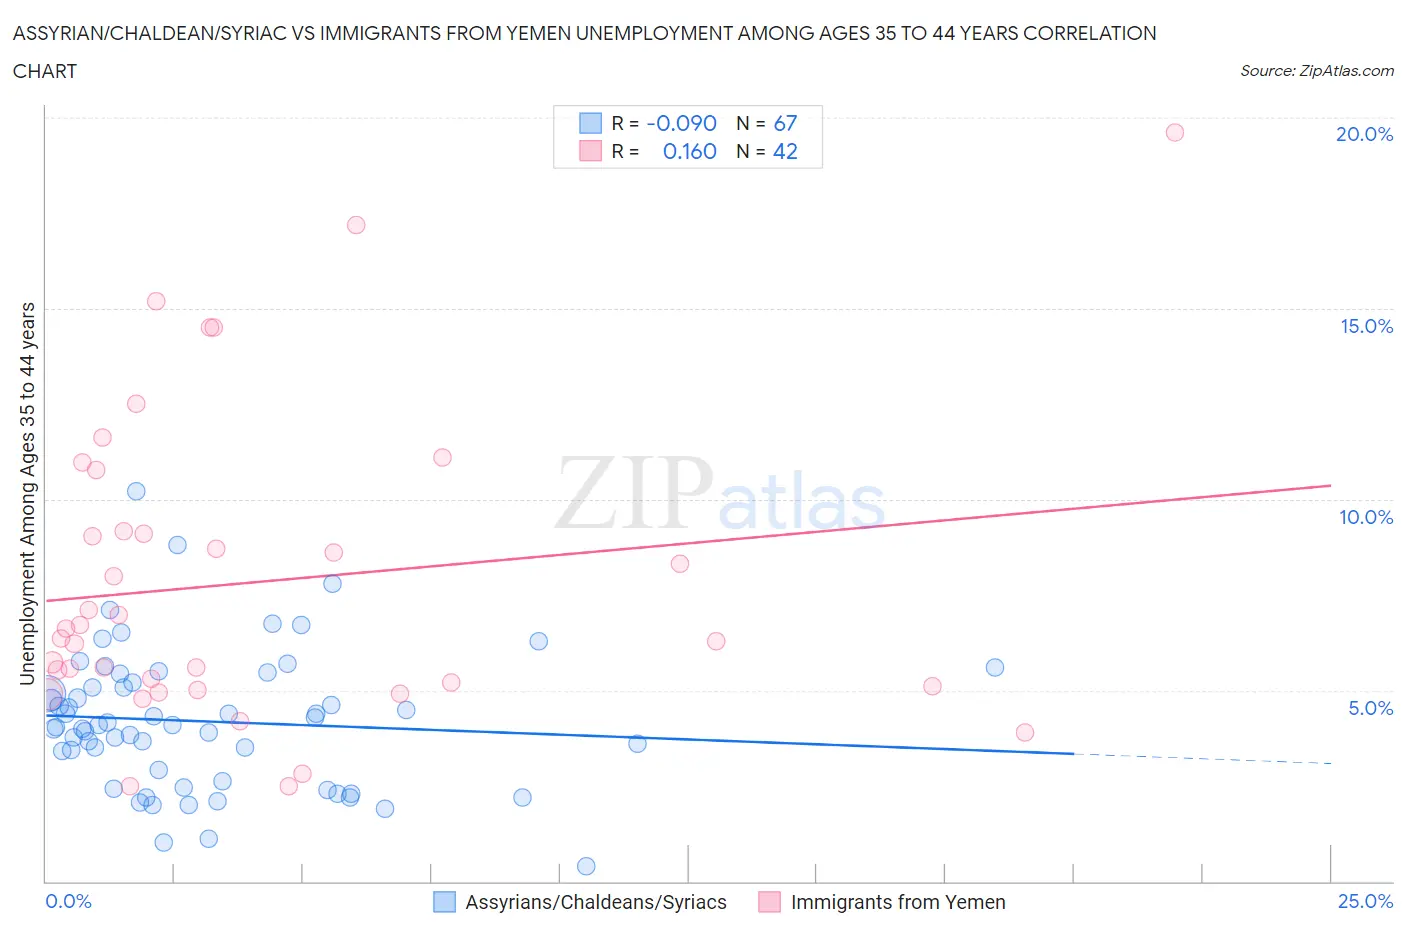
Assyrian/Chaldean/Syriac vs Immigrants from Yemen Unemployment Among Ages 35 to 44 years Correlation Chart
The statistical analysis conducted on geographies consisting of 109,865,928 people shows a slight negative correlation between the proportion of Assyrians/Chaldeans/Syriacs and unemployment rate among population between the ages 35 and 44 in the United States with a correlation coefficient (R) of -0.090 and weighted average of 4.3%. Similarly, the statistical analysis conducted on geographies consisting of 82,232,966 people shows a poor positive correlation between the proportion of Immigrants from Yemen and unemployment rate among population between the ages 35 and 44 in the United States with a correlation coefficient (R) of 0.160 and weighted average of 6.6%, a difference of 53.2%.
Unemployment Among Ages 35 to 44 years Correlation Summary
| Measurement | Assyrian/Chaldean/Syriac | Immigrants from Yemen |
| Minimum | 0.40% | 2.5% |
| Maximum | 10.2% | 19.6% |
| Range | 9.8% | 17.1% |
| Mean | 4.2% | 7.8% |
| Median | 4.1% | 6.5% |
| Interquartile 25% (IQ1) | 2.6% | 5.1% |
| Interquartile 75% (IQ3) | 5.2% | 9.2% |
| Interquartile Range (IQR) | 2.6% | 4.1% |
| Standard Deviation (Sample) | 1.8% | 4.0% |
| Standard Deviation (Population) | 1.8% | 3.9% |
Similar Demographics by Unemployment Among Ages 35 to 44 years
Demographics Similar to Assyrians/Chaldeans/Syriacs by Unemployment Among Ages 35 to 44 years
In terms of unemployment among ages 35 to 44 years, the demographic groups most similar to Assyrians/Chaldeans/Syriacs are Turkish (4.3%, a difference of 0.020%), Bulgarian (4.3%, a difference of 0.080%), Immigrants from Japan (4.3%, a difference of 0.080%), European (4.3%, a difference of 0.27%), and Immigrants from Pakistan (4.3%, a difference of 0.34%).
| Demographics | Rating | Rank | Unemployment Among Ages 35 to 44 years |
| Immigrants | Bolivia | 99.7 /100 | #20 | Exceptional 4.2% |
| Paraguayans | 99.6 /100 | #21 | Exceptional 4.2% |
| Scandinavians | 99.5 /100 | #22 | Exceptional 4.2% |
| Immigrants | Kuwait | 99.5 /100 | #23 | Exceptional 4.3% |
| Tlingit-Haida | 99.5 /100 | #24 | Exceptional 4.3% |
| Bulgarians | 99.3 /100 | #25 | Exceptional 4.3% |
| Turks | 99.3 /100 | #26 | Exceptional 4.3% |
| Assyrians/Chaldeans/Syriacs | 99.3 /100 | #27 | Exceptional 4.3% |
| Immigrants | Japan | 99.3 /100 | #28 | Exceptional 4.3% |
| Europeans | 99.2 /100 | #29 | Exceptional 4.3% |
| Immigrants | Pakistan | 99.2 /100 | #30 | Exceptional 4.3% |
| Carpatho Rusyns | 99.2 /100 | #31 | Exceptional 4.3% |
| Chinese | 99.1 /100 | #32 | Exceptional 4.3% |
| Immigrants | Sri Lanka | 99.1 /100 | #33 | Exceptional 4.3% |
| Jordanians | 99.0 /100 | #34 | Exceptional 4.3% |
Demographics Similar to Immigrants from Yemen by Unemployment Among Ages 35 to 44 years
In terms of unemployment among ages 35 to 44 years, the demographic groups most similar to Immigrants from Yemen are Alaska Native (6.6%, a difference of 0.070%), Cape Verdean (6.6%, a difference of 0.12%), Menominee (6.5%, a difference of 0.36%), Shoshone (6.6%, a difference of 0.81%), and Dominican (6.4%, a difference of 1.9%).
| Demographics | Rating | Rank | Unemployment Among Ages 35 to 44 years |
| Colville | 0.0 /100 | #318 | Tragic 6.2% |
| Immigrants | Grenada | 0.0 /100 | #319 | Tragic 6.2% |
| Immigrants | Armenia | 0.0 /100 | #320 | Tragic 6.2% |
| Chippewa | 0.0 /100 | #321 | Tragic 6.2% |
| Immigrants | Dominican Republic | 0.0 /100 | #322 | Tragic 6.4% |
| Dominicans | 0.0 /100 | #323 | Tragic 6.4% |
| Menominee | 0.0 /100 | #324 | Tragic 6.5% |
| Immigrants | Yemen | 0.0 /100 | #325 | Tragic 6.6% |
| Alaska Natives | 0.0 /100 | #326 | Tragic 6.6% |
| Cape Verdeans | 0.0 /100 | #327 | Tragic 6.6% |
| Shoshone | 0.0 /100 | #328 | Tragic 6.6% |
| Paiute | 0.0 /100 | #329 | Tragic 6.9% |
| Immigrants | Cabo Verde | 0.0 /100 | #330 | Tragic 6.9% |
| Pueblo | 0.0 /100 | #331 | Tragic 7.1% |
| Natives/Alaskans | 0.0 /100 | #332 | Tragic 7.3% |