Inupiat vs Immigrants from Yemen Unemployment Among Ages 35 to 44 years
COMPARE
Inupiat
Immigrants from Yemen
Unemployment Among Ages 35 to 44 years
Unemployment Among Ages 35 to 44 years Comparison
Inupiat
Immigrants from Yemen
8.6%
UNEMPLOYMENT AMONG AGES 35 TO 44 YEARS
0.0/ 100
METRIC RATING
339th/ 347
METRIC RANK
6.6%
UNEMPLOYMENT AMONG AGES 35 TO 44 YEARS
0.0/ 100
METRIC RATING
325th/ 347
METRIC RANK
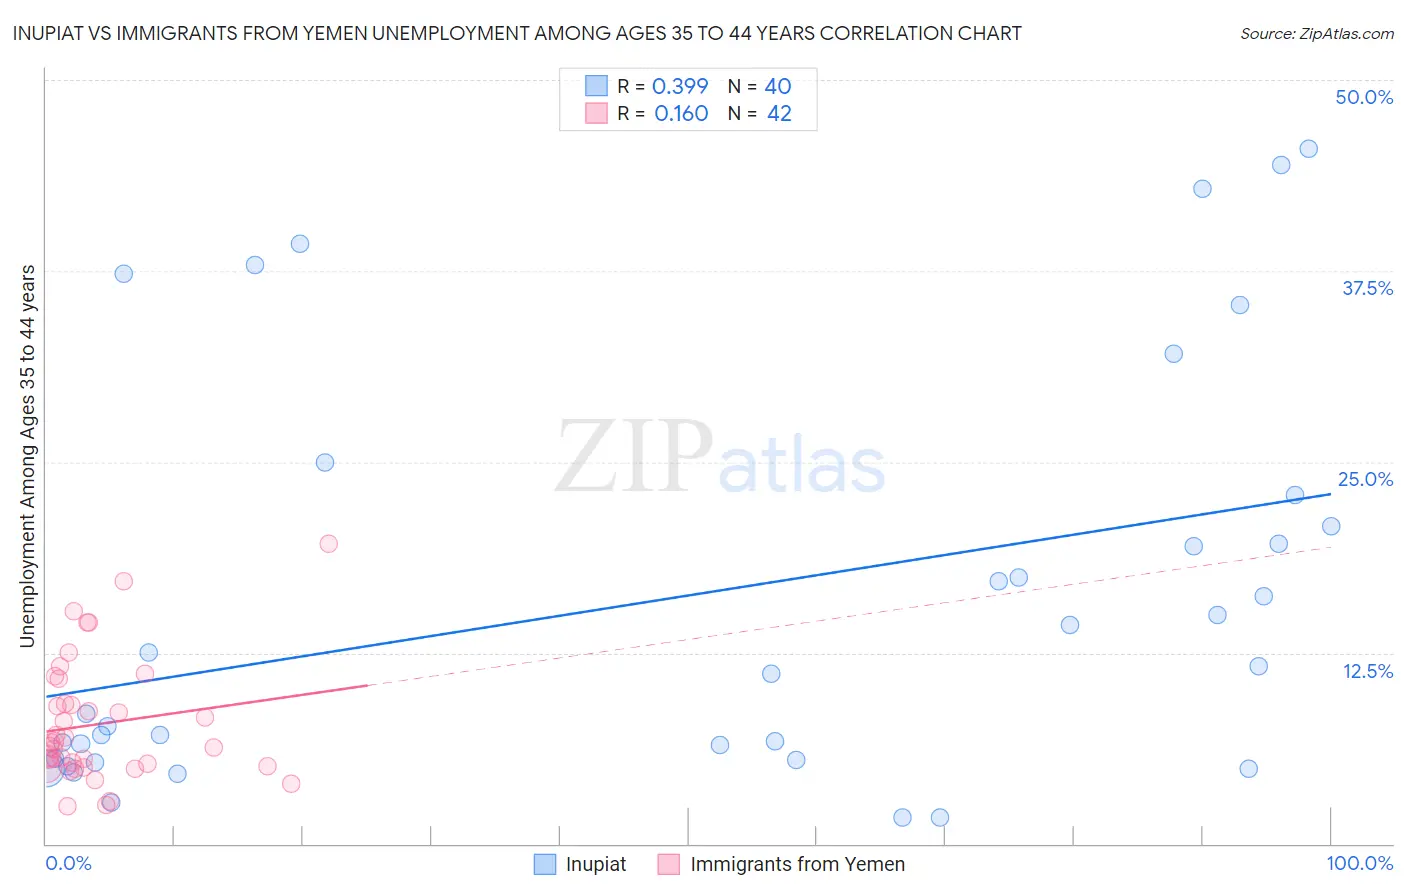
Inupiat vs Immigrants from Yemen Unemployment Among Ages 35 to 44 years Correlation Chart
The statistical analysis conducted on geographies consisting of 95,589,628 people shows a mild positive correlation between the proportion of Inupiat and unemployment rate among population between the ages 35 and 44 in the United States with a correlation coefficient (R) of 0.399 and weighted average of 8.6%. Similarly, the statistical analysis conducted on geographies consisting of 82,232,966 people shows a poor positive correlation between the proportion of Immigrants from Yemen and unemployment rate among population between the ages 35 and 44 in the United States with a correlation coefficient (R) of 0.160 and weighted average of 6.6%, a difference of 30.8%.
Unemployment Among Ages 35 to 44 years Correlation Summary
| Measurement | Inupiat | Immigrants from Yemen |
| Minimum | 1.7% | 2.5% |
| Maximum | 45.5% | 19.6% |
| Range | 43.8% | 17.1% |
| Mean | 16.0% | 7.8% |
| Median | 11.4% | 6.5% |
| Interquartile 25% (IQ1) | 5.5% | 5.1% |
| Interquartile 75% (IQ3) | 21.8% | 9.2% |
| Interquartile Range (IQR) | 16.3% | 4.1% |
| Standard Deviation (Sample) | 13.3% | 4.0% |
| Standard Deviation (Population) | 13.2% | 3.9% |
Demographics Similar to Inupiat and Immigrants from Yemen by Unemployment Among Ages 35 to 44 years
In terms of unemployment among ages 35 to 44 years, the demographic groups most similar to Inupiat are Alaskan Athabascan (8.6%, a difference of 0.69%), Cheyenne (8.5%, a difference of 1.1%), Tohono O'odham (8.4%, a difference of 1.6%), Apache (8.4%, a difference of 2.0%), and Sioux (8.4%, a difference of 2.3%). Similarly, the demographic groups most similar to Immigrants from Yemen are Alaska Native (6.6%, a difference of 0.070%), Cape Verdean (6.6%, a difference of 0.12%), Menominee (6.5%, a difference of 0.36%), Shoshone (6.6%, a difference of 0.81%), and Dominican (6.4%, a difference of 1.9%).
| Demographics | Rating | Rank | Unemployment Among Ages 35 to 44 years |
| Immigrants | Dominican Republic | 0.0 /100 | #322 | Tragic 6.4% |
| Dominicans | 0.0 /100 | #323 | Tragic 6.4% |
| Menominee | 0.0 /100 | #324 | Tragic 6.5% |
| Immigrants | Yemen | 0.0 /100 | #325 | Tragic 6.6% |
| Alaska Natives | 0.0 /100 | #326 | Tragic 6.6% |
| Cape Verdeans | 0.0 /100 | #327 | Tragic 6.6% |
| Shoshone | 0.0 /100 | #328 | Tragic 6.6% |
| Paiute | 0.0 /100 | #329 | Tragic 6.9% |
| Immigrants | Cabo Verde | 0.0 /100 | #330 | Tragic 6.9% |
| Pueblo | 0.0 /100 | #331 | Tragic 7.1% |
| Natives/Alaskans | 0.0 /100 | #332 | Tragic 7.3% |
| Puerto Ricans | 0.0 /100 | #333 | Tragic 7.6% |
| Houma | 0.0 /100 | #334 | Tragic 7.8% |
| Sioux | 0.0 /100 | #335 | Tragic 8.4% |
| Apache | 0.0 /100 | #336 | Tragic 8.4% |
| Tohono O'odham | 0.0 /100 | #337 | Tragic 8.4% |
| Cheyenne | 0.0 /100 | #338 | Tragic 8.5% |
| Inupiat | 0.0 /100 | #339 | Tragic 8.6% |
| Alaskan Athabascans | 0.0 /100 | #340 | Tragic 8.6% |
| Hopi | 0.0 /100 | #341 | Tragic 8.9% |
| Navajo | 0.0 /100 | #342 | Tragic 9.3% |