Pima vs Colombian Unemployment Among Ages 55 to 59 years
COMPARE
Pima
Colombian
Unemployment Among Ages 55 to 59 years
Unemployment Among Ages 55 to 59 years Comparison
Pima
Colombians
6.6%
UNEMPLOYMENT AMONG AGES 55 TO 59 YEARS
0.0/ 100
METRIC RATING
333rd/ 347
METRIC RANK
4.7%
UNEMPLOYMENT AMONG AGES 55 TO 59 YEARS
83.6/ 100
METRIC RATING
136th/ 347
METRIC RANK
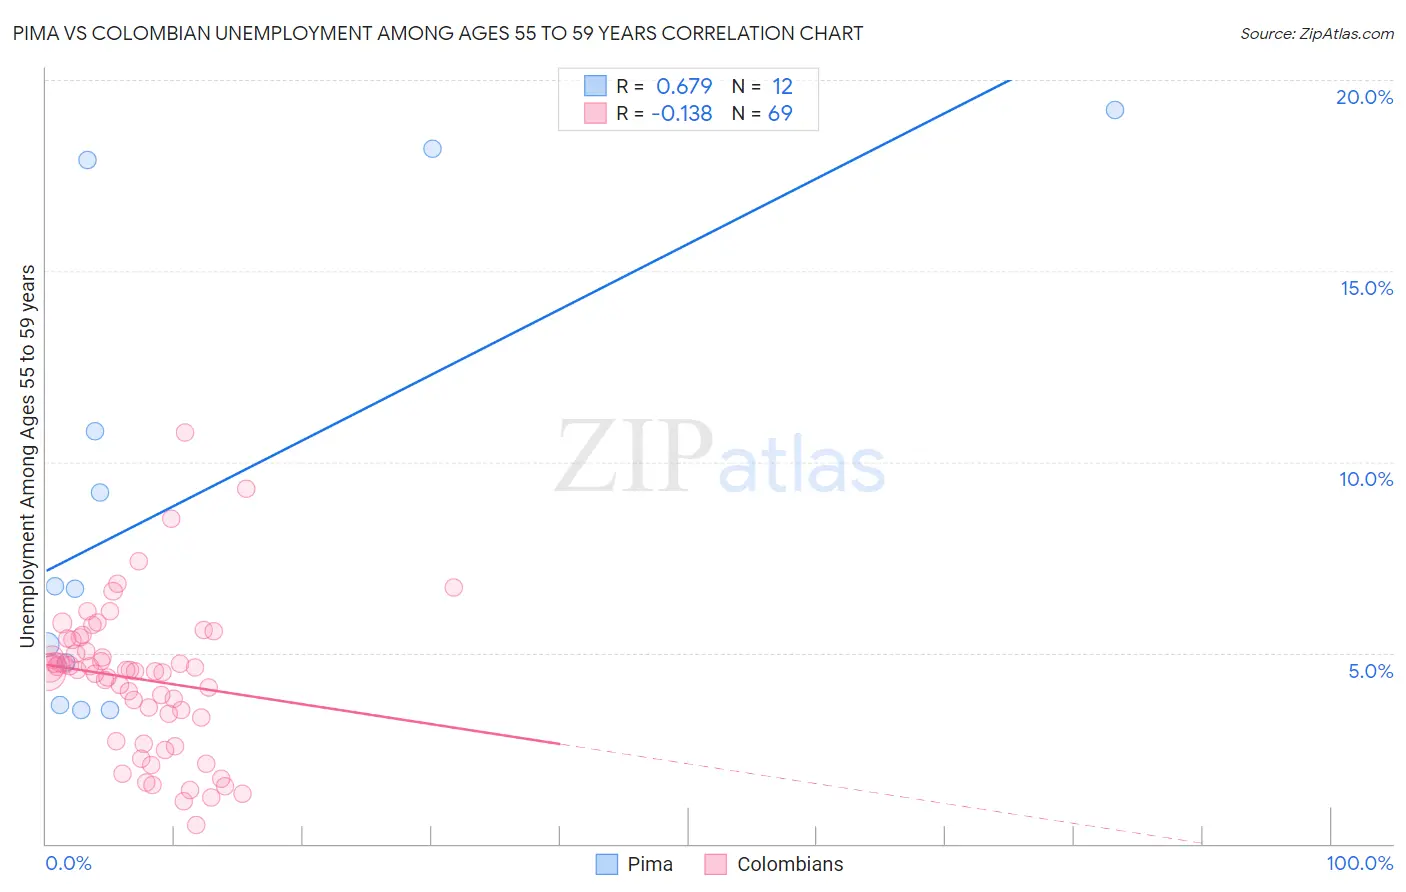
Pima vs Colombian Unemployment Among Ages 55 to 59 years Correlation Chart
The statistical analysis conducted on geographies consisting of 60,402,729 people shows a significant positive correlation between the proportion of Pima and unemployment rate among population between the ages 55 and 59 in the United States with a correlation coefficient (R) of 0.679 and weighted average of 6.6%. Similarly, the statistical analysis conducted on geographies consisting of 390,162,516 people shows a poor negative correlation between the proportion of Colombians and unemployment rate among population between the ages 55 and 59 in the United States with a correlation coefficient (R) of -0.138 and weighted average of 4.7%, a difference of 39.7%.
Unemployment Among Ages 55 to 59 years Correlation Summary
| Measurement | Pima | Colombian |
| Minimum | 3.5% | 0.50% |
| Maximum | 19.2% | 10.8% |
| Range | 15.7% | 10.3% |
| Mean | 9.1% | 4.3% |
| Median | 6.7% | 4.5% |
| Interquartile 25% (IQ1) | 4.2% | 3.0% |
| Interquartile 75% (IQ3) | 14.3% | 5.4% |
| Interquartile Range (IQR) | 10.2% | 2.4% |
| Standard Deviation (Sample) | 6.1% | 1.9% |
| Standard Deviation (Population) | 5.8% | 1.9% |
Similar Demographics by Unemployment Among Ages 55 to 59 years
Demographics Similar to Pima by Unemployment Among Ages 55 to 59 years
In terms of unemployment among ages 55 to 59 years, the demographic groups most similar to Pima are Pueblo (6.7%, a difference of 1.2%), Colville (6.7%, a difference of 1.4%), Navajo (6.7%, a difference of 1.6%), Paiute (6.8%, a difference of 2.1%), and Aleut (6.4%, a difference of 2.8%).
| Demographics | Rating | Rank | Unemployment Among Ages 55 to 59 years |
| Natives/Alaskans | 0.0 /100 | #326 | Tragic 6.0% |
| Arapaho | 0.0 /100 | #327 | Tragic 6.1% |
| Yuman | 0.0 /100 | #328 | Tragic 6.1% |
| Dominicans | 0.0 /100 | #329 | Tragic 6.2% |
| Alaska Natives | 0.0 /100 | #330 | Tragic 6.2% |
| Immigrants | Dominican Republic | 0.0 /100 | #331 | Tragic 6.3% |
| Aleuts | 0.0 /100 | #332 | Tragic 6.4% |
| Pima | 0.0 /100 | #333 | Tragic 6.6% |
| Pueblo | 0.0 /100 | #334 | Tragic 6.7% |
| Colville | 0.0 /100 | #335 | Tragic 6.7% |
| Navajo | 0.0 /100 | #336 | Tragic 6.7% |
| Paiute | 0.0 /100 | #337 | Tragic 6.8% |
| Immigrants | Yemen | 0.0 /100 | #338 | Tragic 6.9% |
| Puerto Ricans | 0.0 /100 | #339 | Tragic 7.0% |
| Alaskan Athabascans | 0.0 /100 | #340 | Tragic 7.1% |
Demographics Similar to Colombians by Unemployment Among Ages 55 to 59 years
In terms of unemployment among ages 55 to 59 years, the demographic groups most similar to Colombians are Delaware (4.7%, a difference of 0.0%), Slavic (4.7%, a difference of 0.010%), Panamanian (4.7%, a difference of 0.040%), Immigrants from Switzerland (4.7%, a difference of 0.050%), and Romanian (4.7%, a difference of 0.060%).
| Demographics | Rating | Rank | Unemployment Among Ages 55 to 59 years |
| Immigrants | Sweden | 86.8 /100 | #129 | Excellent 4.7% |
| Greeks | 86.6 /100 | #130 | Excellent 4.7% |
| Immigrants | Thailand | 85.4 /100 | #131 | Excellent 4.7% |
| Immigrants | Romania | 85.3 /100 | #132 | Excellent 4.7% |
| Immigrants | Netherlands | 84.5 /100 | #133 | Excellent 4.7% |
| Panamanians | 84.1 /100 | #134 | Excellent 4.7% |
| Slavs | 83.7 /100 | #135 | Excellent 4.7% |
| Colombians | 83.6 /100 | #136 | Excellent 4.7% |
| Delaware | 83.6 /100 | #137 | Excellent 4.7% |
| Immigrants | Switzerland | 82.9 /100 | #138 | Excellent 4.7% |
| Romanians | 82.7 /100 | #139 | Excellent 4.7% |
| Immigrants | Indonesia | 80.2 /100 | #140 | Excellent 4.8% |
| French Canadians | 80.1 /100 | #141 | Excellent 4.8% |
| Immigrants | Norway | 79.8 /100 | #142 | Good 4.8% |
| Ukrainians | 78.6 /100 | #143 | Good 4.8% |