Pima vs Immigrants from Israel Unemployment Among Ages 55 to 59 years
COMPARE
Pima
Immigrants from Israel
Unemployment Among Ages 55 to 59 years
Unemployment Among Ages 55 to 59 years Comparison
Pima
Immigrants from Israel
6.6%
UNEMPLOYMENT AMONG AGES 55 TO 59 YEARS
0.0/ 100
METRIC RATING
333rd/ 347
METRIC RANK
5.3%
UNEMPLOYMENT AMONG AGES 55 TO 59 YEARS
0.0/ 100
METRIC RATING
288th/ 347
METRIC RANK
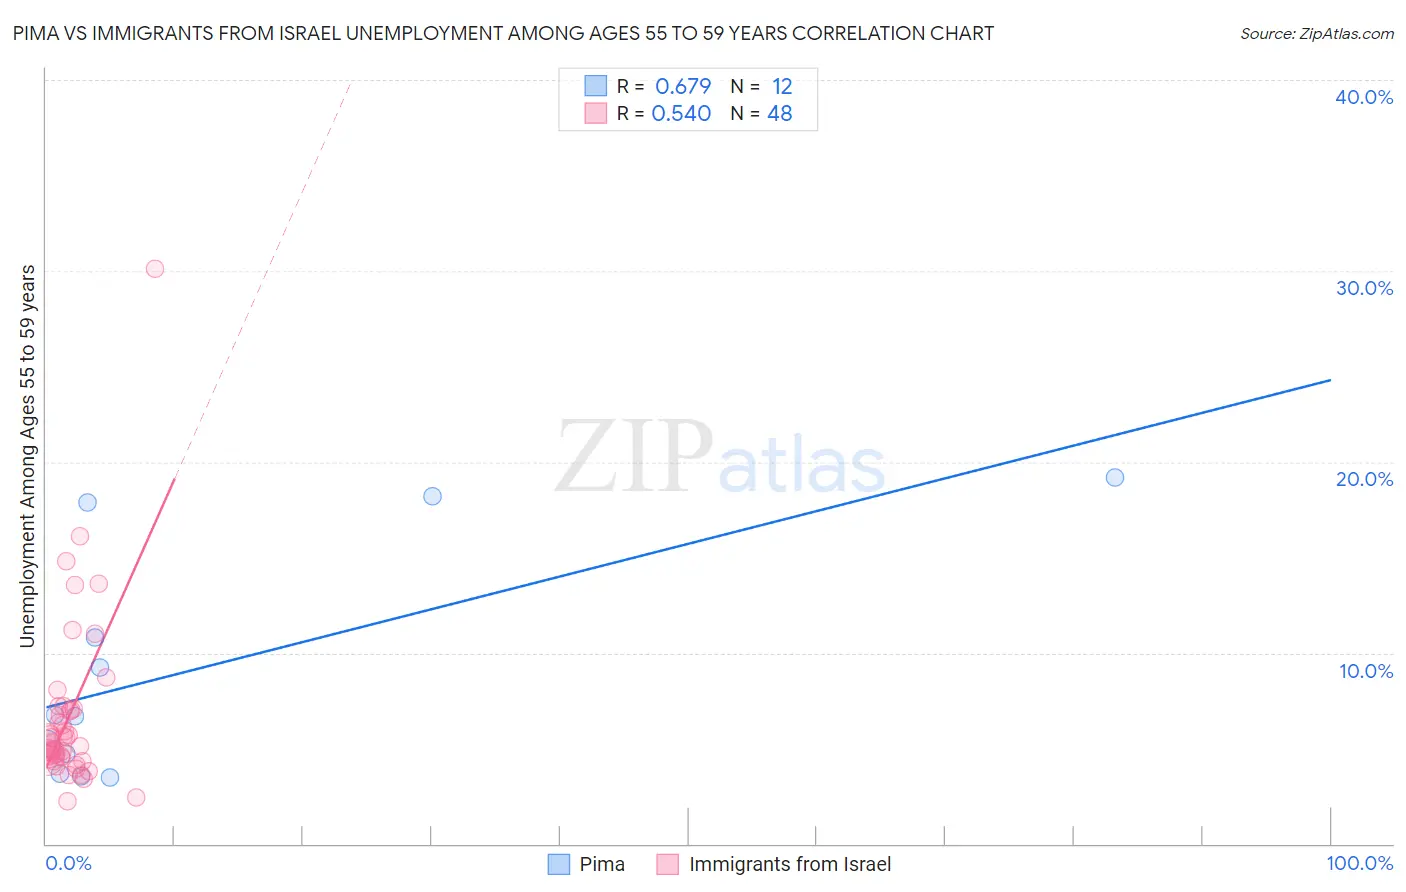
Pima vs Immigrants from Israel Unemployment Among Ages 55 to 59 years Correlation Chart
The statistical analysis conducted on geographies consisting of 60,402,729 people shows a significant positive correlation between the proportion of Pima and unemployment rate among population between the ages 55 and 59 in the United States with a correlation coefficient (R) of 0.679 and weighted average of 6.6%. Similarly, the statistical analysis conducted on geographies consisting of 204,057,833 people shows a substantial positive correlation between the proportion of Immigrants from Israel and unemployment rate among population between the ages 55 and 59 in the United States with a correlation coefficient (R) of 0.540 and weighted average of 5.3%, a difference of 25.1%.
Unemployment Among Ages 55 to 59 years Correlation Summary
| Measurement | Pima | Immigrants from Israel |
| Minimum | 3.5% | 2.2% |
| Maximum | 19.2% | 30.1% |
| Range | 15.7% | 27.9% |
| Mean | 9.1% | 6.7% |
| Median | 6.7% | 5.5% |
| Interquartile 25% (IQ1) | 4.2% | 4.5% |
| Interquartile 75% (IQ3) | 14.3% | 7.0% |
| Interquartile Range (IQR) | 10.2% | 2.5% |
| Standard Deviation (Sample) | 6.1% | 4.6% |
| Standard Deviation (Population) | 5.8% | 4.6% |
Similar Demographics by Unemployment Among Ages 55 to 59 years
Demographics Similar to Pima by Unemployment Among Ages 55 to 59 years
In terms of unemployment among ages 55 to 59 years, the demographic groups most similar to Pima are Pueblo (6.7%, a difference of 1.2%), Colville (6.7%, a difference of 1.4%), Navajo (6.7%, a difference of 1.6%), Paiute (6.8%, a difference of 2.1%), and Aleut (6.4%, a difference of 2.8%).
| Demographics | Rating | Rank | Unemployment Among Ages 55 to 59 years |
| Natives/Alaskans | 0.0 /100 | #326 | Tragic 6.0% |
| Arapaho | 0.0 /100 | #327 | Tragic 6.1% |
| Yuman | 0.0 /100 | #328 | Tragic 6.1% |
| Dominicans | 0.0 /100 | #329 | Tragic 6.2% |
| Alaska Natives | 0.0 /100 | #330 | Tragic 6.2% |
| Immigrants | Dominican Republic | 0.0 /100 | #331 | Tragic 6.3% |
| Aleuts | 0.0 /100 | #332 | Tragic 6.4% |
| Pima | 0.0 /100 | #333 | Tragic 6.6% |
| Pueblo | 0.0 /100 | #334 | Tragic 6.7% |
| Colville | 0.0 /100 | #335 | Tragic 6.7% |
| Navajo | 0.0 /100 | #336 | Tragic 6.7% |
| Paiute | 0.0 /100 | #337 | Tragic 6.8% |
| Immigrants | Yemen | 0.0 /100 | #338 | Tragic 6.9% |
| Puerto Ricans | 0.0 /100 | #339 | Tragic 7.0% |
| Alaskan Athabascans | 0.0 /100 | #340 | Tragic 7.1% |
Demographics Similar to Immigrants from Israel by Unemployment Among Ages 55 to 59 years
In terms of unemployment among ages 55 to 59 years, the demographic groups most similar to Immigrants from Israel are Immigrants from Guatemala (5.3%, a difference of 0.010%), Immigrants from Ghana (5.3%, a difference of 0.030%), Immigrants from Central America (5.3%, a difference of 0.060%), Sioux (5.3%, a difference of 0.090%), and Armenian (5.3%, a difference of 0.15%).
| Demographics | Rating | Rank | Unemployment Among Ages 55 to 59 years |
| Guatemalans | 0.0 /100 | #281 | Tragic 5.3% |
| Immigrants | Trinidad and Tobago | 0.0 /100 | #282 | Tragic 5.3% |
| Apache | 0.0 /100 | #283 | Tragic 5.3% |
| Ghanaians | 0.0 /100 | #284 | Tragic 5.3% |
| Armenians | 0.0 /100 | #285 | Tragic 5.3% |
| Immigrants | Ghana | 0.0 /100 | #286 | Tragic 5.3% |
| Immigrants | Guatemala | 0.0 /100 | #287 | Tragic 5.3% |
| Immigrants | Israel | 0.0 /100 | #288 | Tragic 5.3% |
| Immigrants | Central America | 0.0 /100 | #289 | Tragic 5.3% |
| Sioux | 0.0 /100 | #290 | Tragic 5.3% |
| Trinidadians and Tobagonians | 0.0 /100 | #291 | Tragic 5.3% |
| British West Indians | 0.0 /100 | #292 | Tragic 5.3% |
| Immigrants | Grenada | 0.0 /100 | #293 | Tragic 5.3% |
| Cajuns | 0.0 /100 | #294 | Tragic 5.3% |
| Dutch West Indians | 0.0 /100 | #295 | Tragic 5.3% |