Pima vs Immigrants from Latvia Unemployment Among Youth under 25 years
COMPARE
Pima
Immigrants from Latvia
Unemployment Among Youth under 25 years
Unemployment Among Youth under 25 years Comparison
Pima
Immigrants from Latvia
16.2%
UNEMPLOYMENT AMONG YOUTH UNDER 25 YEARS
0.0/ 100
METRIC RATING
336th/ 347
METRIC RANK
11.2%
UNEMPLOYMENT AMONG YOUTH UNDER 25 YEARS
95.1/ 100
METRIC RATING
92nd/ 347
METRIC RANK
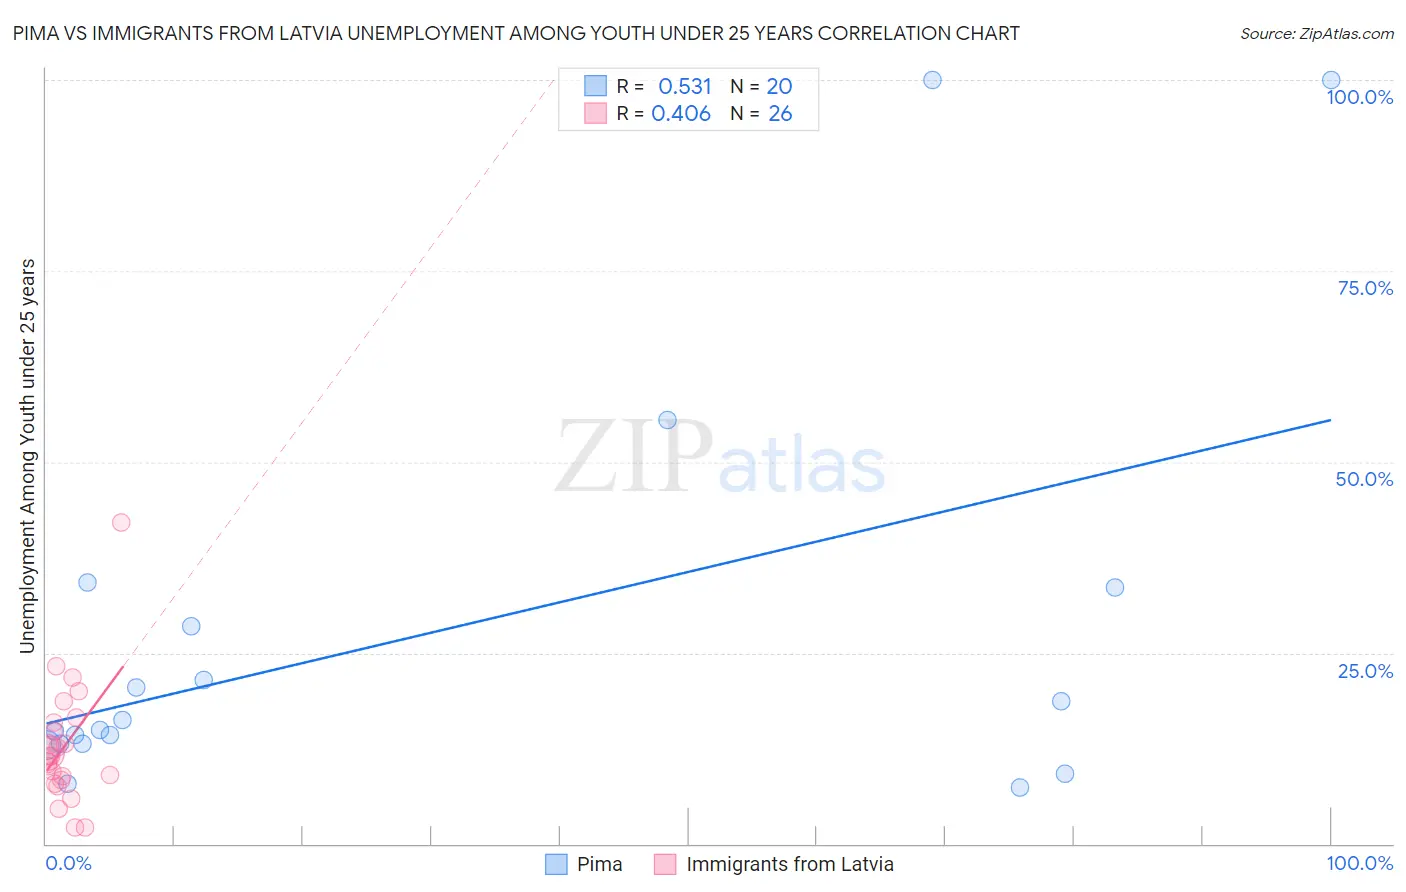
Pima vs Immigrants from Latvia Unemployment Among Youth under 25 years Correlation Chart
The statistical analysis conducted on geographies consisting of 61,326,088 people shows a substantial positive correlation between the proportion of Pima and unemployment rate among youth under the age of 25 in the United States with a correlation coefficient (R) of 0.531 and weighted average of 16.2%. Similarly, the statistical analysis conducted on geographies consisting of 113,252,048 people shows a moderate positive correlation between the proportion of Immigrants from Latvia and unemployment rate among youth under the age of 25 in the United States with a correlation coefficient (R) of 0.406 and weighted average of 11.2%, a difference of 44.4%.
Unemployment Among Youth under 25 years Correlation Summary
| Measurement | Pima | Immigrants from Latvia |
| Minimum | 7.3% | 2.1% |
| Maximum | 100.0% | 42.1% |
| Range | 92.7% | 40.0% |
| Mean | 27.5% | 12.8% |
| Median | 15.5% | 11.4% |
| Interquartile 25% (IQ1) | 13.1% | 8.3% |
| Interquartile 75% (IQ3) | 30.9% | 15.8% |
| Interquartile Range (IQR) | 17.9% | 7.5% |
| Standard Deviation (Sample) | 27.2% | 8.1% |
| Standard Deviation (Population) | 26.6% | 7.9% |
Similar Demographics by Unemployment Among Youth under 25 years
Demographics Similar to Pima by Unemployment Among Youth under 25 years
In terms of unemployment among youth under 25 years, the demographic groups most similar to Pima are Arapaho (16.3%, a difference of 0.16%), Yuman (16.3%, a difference of 0.45%), Immigrants from St. Vincent and the Grenadines (16.1%, a difference of 0.64%), Tsimshian (16.5%, a difference of 1.5%), and Immigrants from Guyana (15.9%, a difference of 1.9%).
| Demographics | Rating | Rank | Unemployment Among Youth under 25 years |
| Immigrants | Yemen | 0.0 /100 | #329 | Tragic 15.6% |
| Yakama | 0.0 /100 | #330 | Tragic 15.6% |
| Dominicans | 0.0 /100 | #331 | Tragic 15.7% |
| Immigrants | Grenada | 0.0 /100 | #332 | Tragic 15.8% |
| Guyanese | 0.0 /100 | #333 | Tragic 15.9% |
| Immigrants | Guyana | 0.0 /100 | #334 | Tragic 15.9% |
| Immigrants | St. Vincent and the Grenadines | 0.0 /100 | #335 | Tragic 16.1% |
| Pima | 0.0 /100 | #336 | Tragic 16.2% |
| Arapaho | 0.0 /100 | #337 | Tragic 16.3% |
| Yuman | 0.0 /100 | #338 | Tragic 16.3% |
| Tsimshian | 0.0 /100 | #339 | Tragic 16.5% |
| Colville | 0.0 /100 | #340 | Tragic 16.8% |
| Paiute | 0.0 /100 | #341 | Tragic 17.6% |
| Puerto Ricans | 0.0 /100 | #342 | Tragic 18.4% |
| Navajo | 0.0 /100 | #343 | Tragic 18.6% |
Demographics Similar to Immigrants from Latvia by Unemployment Among Youth under 25 years
In terms of unemployment among youth under 25 years, the demographic groups most similar to Immigrants from Latvia are Immigrants from Taiwan (11.2%, a difference of 0.0%), Immigrants from North America (11.2%, a difference of 0.0%), Lithuanian (11.3%, a difference of 0.070%), Immigrants from Bolivia (11.2%, a difference of 0.080%), and Immigrants from Japan (11.2%, a difference of 0.090%).
| Demographics | Rating | Rank | Unemployment Among Youth under 25 years |
| Immigrants | South Central Asia | 95.9 /100 | #85 | Exceptional 11.2% |
| Immigrants | South Africa | 95.8 /100 | #86 | Exceptional 11.2% |
| Kenyans | 95.7 /100 | #87 | Exceptional 11.2% |
| Austrians | 95.5 /100 | #88 | Exceptional 11.2% |
| Immigrants | Japan | 95.5 /100 | #89 | Exceptional 11.2% |
| Immigrants | Bolivia | 95.5 /100 | #90 | Exceptional 11.2% |
| Immigrants | Taiwan | 95.1 /100 | #91 | Exceptional 11.2% |
| Immigrants | Latvia | 95.1 /100 | #92 | Exceptional 11.2% |
| Immigrants | North America | 95.1 /100 | #93 | Exceptional 11.2% |
| Lithuanians | 94.8 /100 | #94 | Exceptional 11.3% |
| Carpatho Rusyns | 94.4 /100 | #95 | Exceptional 11.3% |
| Immigrants | Serbia | 94.4 /100 | #96 | Exceptional 11.3% |
| Nicaraguans | 94.3 /100 | #97 | Exceptional 11.3% |
| Estonians | 94.2 /100 | #98 | Exceptional 11.3% |
| Celtics | 94.0 /100 | #99 | Exceptional 11.3% |