Peruvian vs Somali Unemployment Among Youth under 25 years
COMPARE
Peruvian
Somali
Unemployment Among Youth under 25 years
Unemployment Among Youth under 25 years Comparison
Peruvians
Somalis
11.8%
UNEMPLOYMENT AMONG YOUTH UNDER 25 YEARS
14.0/ 100
METRIC RATING
205th/ 347
METRIC RANK
10.7%
UNEMPLOYMENT AMONG YOUTH UNDER 25 YEARS
100.0/ 100
METRIC RATING
28th/ 347
METRIC RANK
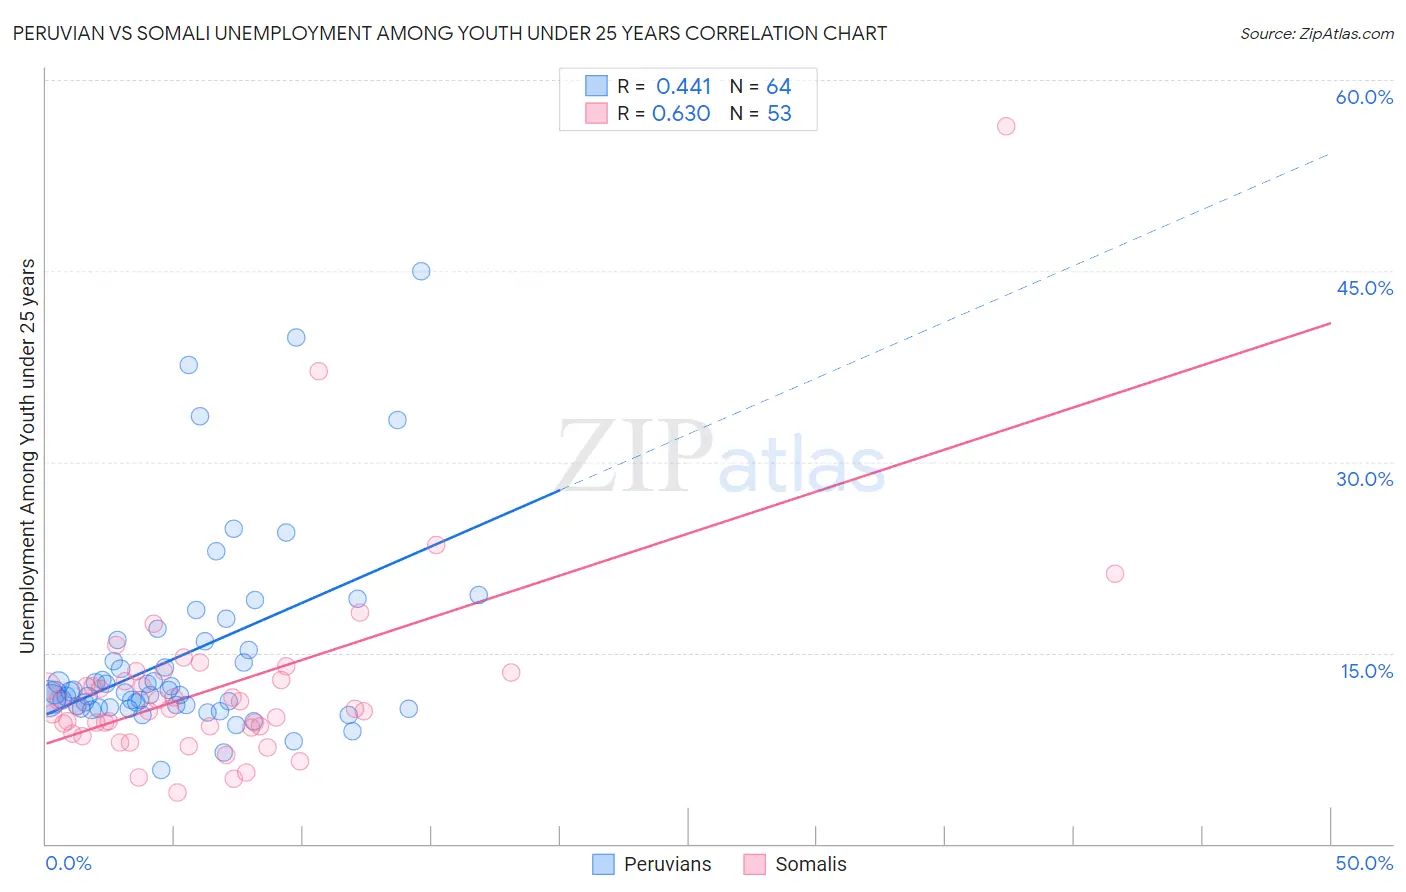
Peruvian vs Somali Unemployment Among Youth under 25 years Correlation Chart
The statistical analysis conducted on geographies consisting of 360,264,101 people shows a moderate positive correlation between the proportion of Peruvians and unemployment rate among youth under the age of 25 in the United States with a correlation coefficient (R) of 0.441 and weighted average of 11.8%. Similarly, the statistical analysis conducted on geographies consisting of 99,064,920 people shows a significant positive correlation between the proportion of Somalis and unemployment rate among youth under the age of 25 in the United States with a correlation coefficient (R) of 0.630 and weighted average of 10.7%, a difference of 10.8%.
Unemployment Among Youth under 25 years Correlation Summary
| Measurement | Peruvian | Somali |
| Minimum | 5.8% | 4.0% |
| Maximum | 45.0% | 56.4% |
| Range | 39.2% | 52.4% |
| Mean | 14.8% | 12.4% |
| Median | 11.9% | 10.6% |
| Interquartile 25% (IQ1) | 10.8% | 9.1% |
| Interquartile 75% (IQ3) | 15.6% | 13.2% |
| Interquartile Range (IQR) | 4.8% | 4.1% |
| Standard Deviation (Sample) | 7.8% | 8.0% |
| Standard Deviation (Population) | 7.7% | 7.9% |
Similar Demographics by Unemployment Among Youth under 25 years
Demographics Similar to Peruvians by Unemployment Among Youth under 25 years
In terms of unemployment among youth under 25 years, the demographic groups most similar to Peruvians are Immigrants from Peru (11.8%, a difference of 0.10%), Immigrants from Costa Rica (11.8%, a difference of 0.10%), Immigrants from Pakistan (11.8%, a difference of 0.13%), Marshallese (11.8%, a difference of 0.14%), and Immigrants from Southern Europe (11.8%, a difference of 0.15%).
| Demographics | Rating | Rank | Unemployment Among Youth under 25 years |
| Cherokee | 21.2 /100 | #198 | Fair 11.8% |
| Immigrants | Colombia | 20.9 /100 | #199 | Fair 11.8% |
| Arabs | 18.0 /100 | #200 | Poor 11.8% |
| Palestinians | 16.0 /100 | #201 | Poor 11.8% |
| Marshallese | 15.8 /100 | #202 | Poor 11.8% |
| Immigrants | Peru | 15.3 /100 | #203 | Poor 11.8% |
| Immigrants | Costa Rica | 15.2 /100 | #204 | Poor 11.8% |
| Peruvians | 14.0 /100 | #205 | Poor 11.8% |
| Immigrants | Pakistan | 12.6 /100 | #206 | Poor 11.8% |
| Immigrants | Southern Europe | 12.3 /100 | #207 | Poor 11.8% |
| Comanche | 12.1 /100 | #208 | Poor 11.8% |
| Immigrants | Lebanon | 11.3 /100 | #209 | Poor 11.8% |
| Assyrians/Chaldeans/Syriacs | 9.8 /100 | #210 | Tragic 11.9% |
| Immigrants | Philippines | 9.2 /100 | #211 | Tragic 11.9% |
| Colombians | 9.1 /100 | #212 | Tragic 11.9% |
Demographics Similar to Somalis by Unemployment Among Youth under 25 years
In terms of unemployment among youth under 25 years, the demographic groups most similar to Somalis are Yugoslavian (10.7%, a difference of 0.040%), Immigrants from India (10.7%, a difference of 0.060%), Finnish (10.7%, a difference of 0.15%), Immigrants from North Macedonia (10.7%, a difference of 0.15%), and Chinese (10.7%, a difference of 0.34%).
| Demographics | Rating | Rank | Unemployment Among Youth under 25 years |
| Pennsylvania Germans | 100.0 /100 | #21 | Exceptional 10.6% |
| Belgians | 100.0 /100 | #22 | Exceptional 10.6% |
| Immigrants | Bosnia and Herzegovina | 100.0 /100 | #23 | Exceptional 10.6% |
| Finns | 100.0 /100 | #24 | Exceptional 10.7% |
| Immigrants | North Macedonia | 100.0 /100 | #25 | Exceptional 10.7% |
| Immigrants | India | 100.0 /100 | #26 | Exceptional 10.7% |
| Yugoslavians | 100.0 /100 | #27 | Exceptional 10.7% |
| Somalis | 100.0 /100 | #28 | Exceptional 10.7% |
| Chinese | 99.9 /100 | #29 | Exceptional 10.7% |
| Osage | 99.9 /100 | #30 | Exceptional 10.7% |
| Slovenes | 99.9 /100 | #31 | Exceptional 10.7% |
| Taiwanese | 99.9 /100 | #32 | Exceptional 10.8% |
| Europeans | 99.9 /100 | #33 | Exceptional 10.8% |
| English | 99.9 /100 | #34 | Exceptional 10.8% |
| Immigrants | Nepal | 99.9 /100 | #35 | Exceptional 10.8% |