Pennsylvania German vs Immigrants from Bosnia and Herzegovina Male Unemployment
COMPARE
Pennsylvania German
Immigrants from Bosnia and Herzegovina
Male Unemployment
Male Unemployment Comparison
Pennsylvania Germans
Immigrants from Bosnia and Herzegovina
4.8%
MALE UNEMPLOYMENT
99.9/ 100
METRIC RATING
20th/ 347
METRIC RANK
4.9%
MALE UNEMPLOYMENT
99.4/ 100
METRIC RATING
38th/ 347
METRIC RANK
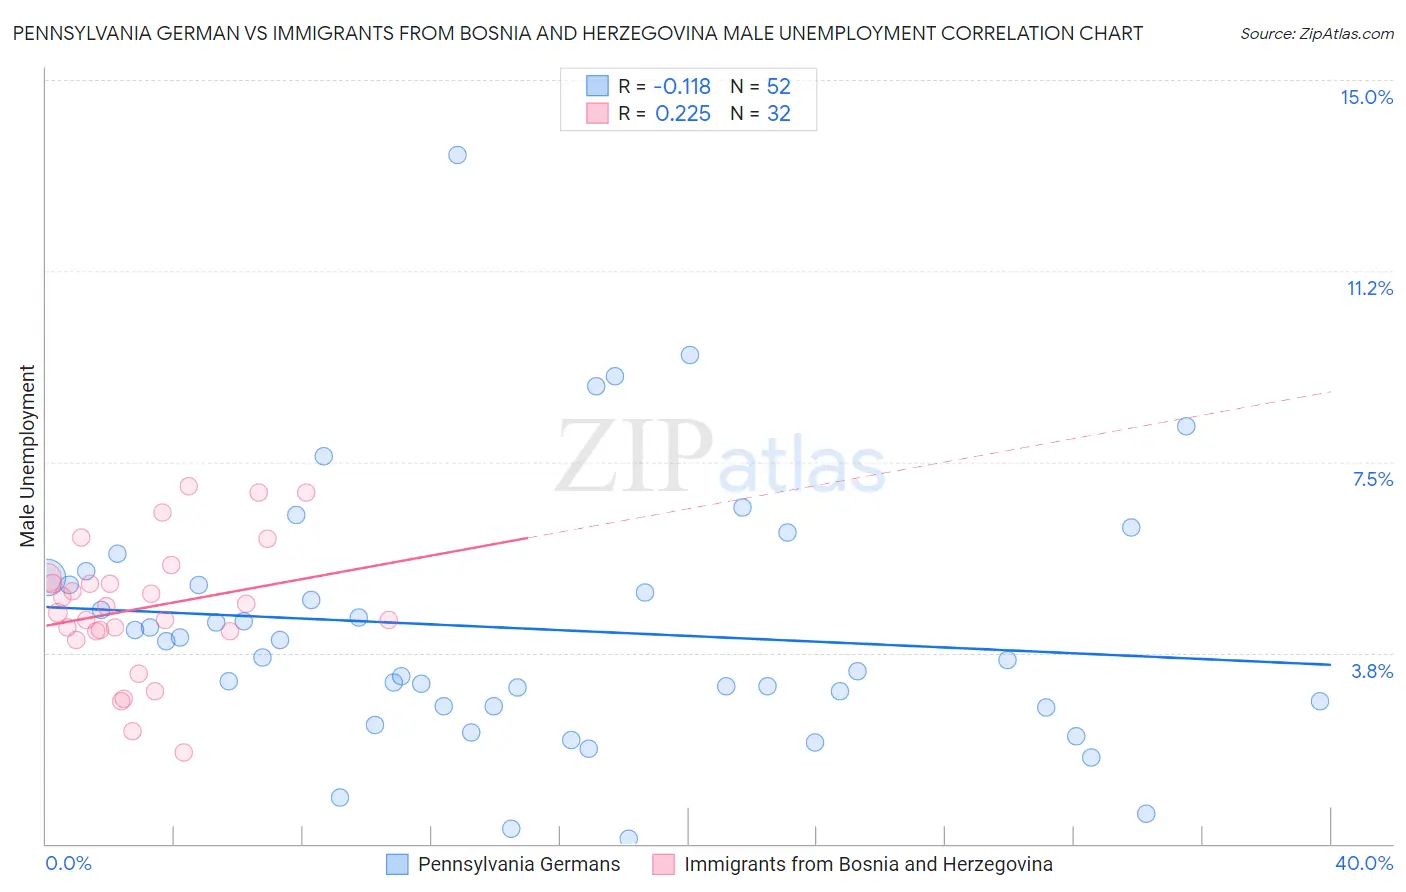
Pennsylvania German vs Immigrants from Bosnia and Herzegovina Male Unemployment Correlation Chart
The statistical analysis conducted on geographies consisting of 232,803,431 people shows a poor negative correlation between the proportion of Pennsylvania Germans and unemployment rate among males in the United States with a correlation coefficient (R) of -0.118 and weighted average of 4.8%. Similarly, the statistical analysis conducted on geographies consisting of 156,632,183 people shows a weak positive correlation between the proportion of Immigrants from Bosnia and Herzegovina and unemployment rate among males in the United States with a correlation coefficient (R) of 0.225 and weighted average of 4.9%, a difference of 3.0%.
Male Unemployment Correlation Summary
| Measurement | Pennsylvania German | Immigrants from Bosnia and Herzegovina |
| Minimum | 0.10% | 1.8% |
| Maximum | 13.5% | 7.0% |
| Range | 13.4% | 5.2% |
| Mean | 4.2% | 4.6% |
| Median | 3.8% | 4.6% |
| Interquartile 25% (IQ1) | 2.7% | 4.2% |
| Interquartile 75% (IQ3) | 5.2% | 5.2% |
| Interquartile Range (IQR) | 2.5% | 0.99% |
| Standard Deviation (Sample) | 2.5% | 1.3% |
| Standard Deviation (Population) | 2.5% | 1.3% |
Demographics Similar to Pennsylvania Germans and Immigrants from Bosnia and Herzegovina by Male Unemployment
In terms of male unemployment, the demographic groups most similar to Pennsylvania Germans are European (4.8%, a difference of 0.050%), Immigrants from Taiwan (4.8%, a difference of 0.16%), Carpatho Rusyn (4.8%, a difference of 0.18%), Tongan (4.8%, a difference of 0.22%), and Immigrants from South Central Asia (4.8%, a difference of 0.25%). Similarly, the demographic groups most similar to Immigrants from Bosnia and Herzegovina are Scotch-Irish (4.9%, a difference of 0.020%), Burmese (4.9%, a difference of 0.070%), Immigrants from Singapore (4.9%, a difference of 0.23%), Paraguayan (4.9%, a difference of 0.31%), and Welsh (4.8%, a difference of 1.2%).
| Demographics | Rating | Rank | Male Unemployment |
| Europeans | 99.9 /100 | #19 | Exceptional 4.8% |
| Pennsylvania Germans | 99.9 /100 | #20 | Exceptional 4.8% |
| Immigrants | Taiwan | 99.9 /100 | #21 | Exceptional 4.8% |
| Carpatho Rusyns | 99.9 /100 | #22 | Exceptional 4.8% |
| Tongans | 99.9 /100 | #23 | Exceptional 4.8% |
| Immigrants | South Central Asia | 99.9 /100 | #24 | Exceptional 4.8% |
| Zimbabweans | 99.9 /100 | #25 | Exceptional 4.8% |
| Dutch | 99.9 /100 | #26 | Exceptional 4.8% |
| Belgians | 99.9 /100 | #27 | Exceptional 4.8% |
| Bulgarians | 99.8 /100 | #28 | Exceptional 4.8% |
| Scottish | 99.8 /100 | #29 | Exceptional 4.8% |
| British | 99.8 /100 | #30 | Exceptional 4.8% |
| Sudanese | 99.8 /100 | #31 | Exceptional 4.8% |
| Immigrants | Nepal | 99.8 /100 | #32 | Exceptional 4.8% |
| Latvians | 99.7 /100 | #33 | Exceptional 4.8% |
| Welsh | 99.7 /100 | #34 | Exceptional 4.8% |
| Paraguayans | 99.5 /100 | #35 | Exceptional 4.9% |
| Immigrants | Singapore | 99.4 /100 | #36 | Exceptional 4.9% |
| Scotch-Irish | 99.4 /100 | #37 | Exceptional 4.9% |
| Immigrants | Bosnia and Herzegovina | 99.4 /100 | #38 | Exceptional 4.9% |
| Burmese | 99.3 /100 | #39 | Exceptional 4.9% |