Pennsylvania German vs Malaysian Male Unemployment
COMPARE
Pennsylvania German
Malaysian
Male Unemployment
Male Unemployment Comparison
Pennsylvania Germans
Malaysians
4.8%
MALE UNEMPLOYMENT
99.9/ 100
METRIC RATING
20th/ 347
METRIC RANK
5.3%
MALE UNEMPLOYMENT
39.6/ 100
METRIC RATING
180th/ 347
METRIC RANK
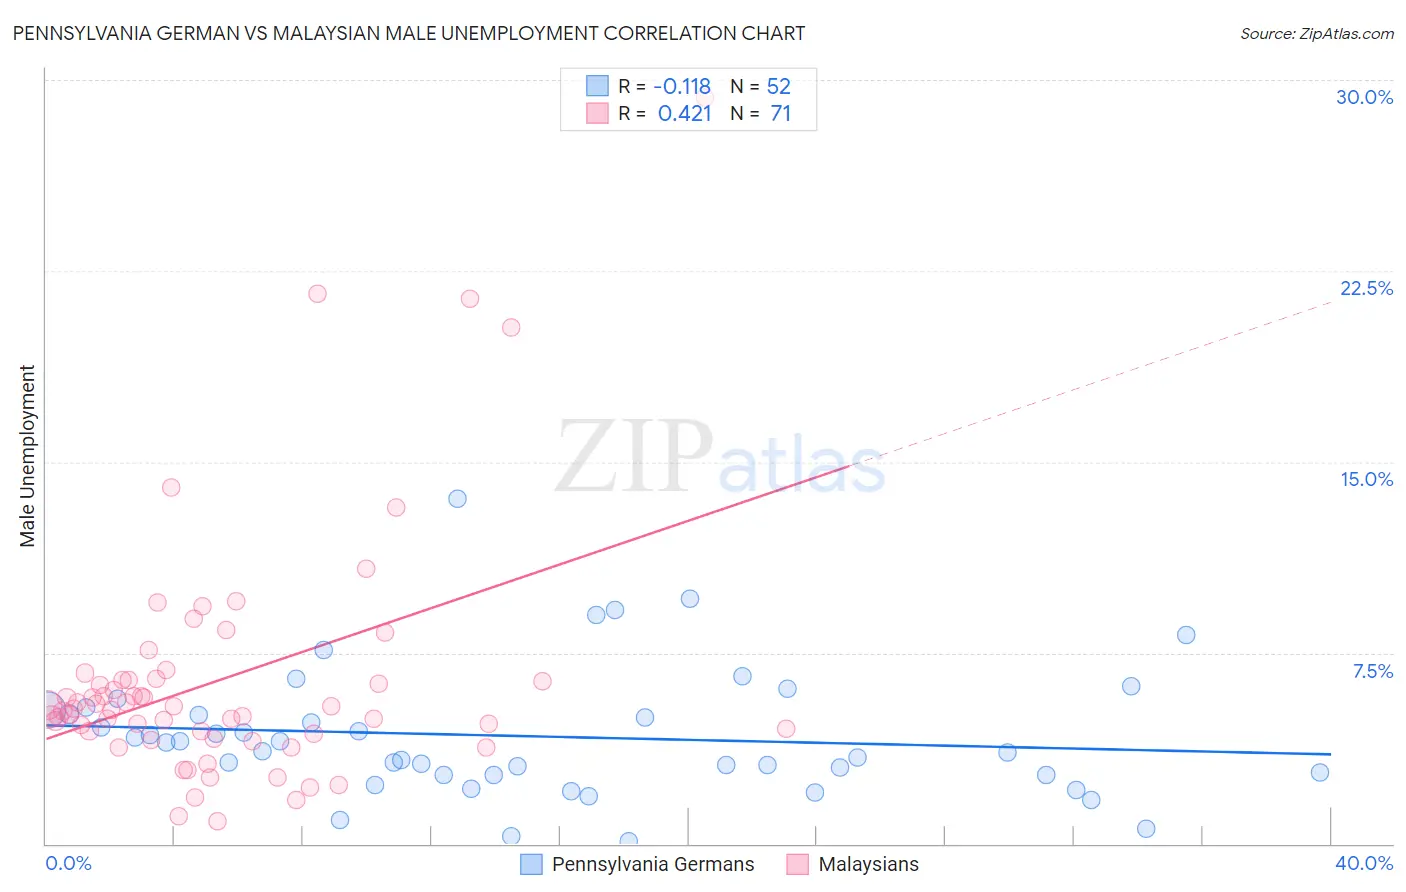
Pennsylvania German vs Malaysian Male Unemployment Correlation Chart
The statistical analysis conducted on geographies consisting of 232,803,431 people shows a poor negative correlation between the proportion of Pennsylvania Germans and unemployment rate among males in the United States with a correlation coefficient (R) of -0.118 and weighted average of 4.8%. Similarly, the statistical analysis conducted on geographies consisting of 225,737,190 people shows a moderate positive correlation between the proportion of Malaysians and unemployment rate among males in the United States with a correlation coefficient (R) of 0.421 and weighted average of 5.3%, a difference of 11.9%.
Male Unemployment Correlation Summary
| Measurement | Pennsylvania German | Malaysian |
| Minimum | 0.10% | 0.90% |
| Maximum | 13.5% | 29.3% |
| Range | 13.4% | 28.4% |
| Mean | 4.2% | 6.4% |
| Median | 3.8% | 5.3% |
| Interquartile 25% (IQ1) | 2.7% | 4.3% |
| Interquartile 75% (IQ3) | 5.2% | 6.4% |
| Interquartile Range (IQR) | 2.5% | 2.1% |
| Standard Deviation (Sample) | 2.5% | 4.8% |
| Standard Deviation (Population) | 2.5% | 4.8% |
Similar Demographics by Male Unemployment
Demographics Similar to Pennsylvania Germans by Male Unemployment
In terms of male unemployment, the demographic groups most similar to Pennsylvania Germans are European (4.8%, a difference of 0.050%), English (4.8%, a difference of 0.080%), Immigrants from Taiwan (4.8%, a difference of 0.16%), Carpatho Rusyn (4.8%, a difference of 0.18%), and Tongan (4.8%, a difference of 0.22%).
| Demographics | Rating | Rank | Male Unemployment |
| Bolivians | 100.0 /100 | #13 | Exceptional 4.7% |
| Germans | 100.0 /100 | #14 | Exceptional 4.7% |
| Scandinavians | 100.0 /100 | #15 | Exceptional 4.7% |
| Swiss | 99.9 /100 | #16 | Exceptional 4.7% |
| Filipinos | 99.9 /100 | #17 | Exceptional 4.7% |
| English | 99.9 /100 | #18 | Exceptional 4.8% |
| Europeans | 99.9 /100 | #19 | Exceptional 4.8% |
| Pennsylvania Germans | 99.9 /100 | #20 | Exceptional 4.8% |
| Immigrants | Taiwan | 99.9 /100 | #21 | Exceptional 4.8% |
| Carpatho Rusyns | 99.9 /100 | #22 | Exceptional 4.8% |
| Tongans | 99.9 /100 | #23 | Exceptional 4.8% |
| Immigrants | South Central Asia | 99.9 /100 | #24 | Exceptional 4.8% |
| Zimbabweans | 99.9 /100 | #25 | Exceptional 4.8% |
| Dutch | 99.9 /100 | #26 | Exceptional 4.8% |
| Belgians | 99.9 /100 | #27 | Exceptional 4.8% |
Demographics Similar to Malaysians by Male Unemployment
In terms of male unemployment, the demographic groups most similar to Malaysians are Immigrants from Oceania (5.3%, a difference of 0.070%), Immigrants from Afghanistan (5.3%, a difference of 0.10%), Potawatomi (5.3%, a difference of 0.11%), Taiwanese (5.3%, a difference of 0.12%), and Osage (5.3%, a difference of 0.17%).
| Demographics | Rating | Rank | Male Unemployment |
| Immigrants | Russia | 50.7 /100 | #173 | Average 5.3% |
| Immigrants | Iran | 50.0 /100 | #174 | Average 5.3% |
| Immigrants | Iraq | 48.1 /100 | #175 | Average 5.3% |
| Immigrants | Poland | 46.0 /100 | #176 | Average 5.3% |
| Immigrants | Peru | 44.6 /100 | #177 | Average 5.3% |
| Osage | 42.5 /100 | #178 | Average 5.3% |
| Immigrants | Oceania | 40.8 /100 | #179 | Average 5.3% |
| Malaysians | 39.6 /100 | #180 | Fair 5.3% |
| Immigrants | Afghanistan | 37.9 /100 | #181 | Fair 5.3% |
| Potawatomi | 37.8 /100 | #182 | Fair 5.3% |
| Taiwanese | 37.6 /100 | #183 | Fair 5.3% |
| Spaniards | 35.1 /100 | #184 | Fair 5.3% |
| Koreans | 34.9 /100 | #185 | Fair 5.3% |
| Iraqis | 31.6 /100 | #186 | Fair 5.4% |
| Costa Ricans | 31.3 /100 | #187 | Fair 5.4% |