Paraguayan vs Yugoslavian Unemployment Among Ages 55 to 59 years
COMPARE
Paraguayan
Yugoslavian
Unemployment Among Ages 55 to 59 years
Unemployment Among Ages 55 to 59 years Comparison
Paraguayans
Yugoslavians
5.1%
UNEMPLOYMENT AMONG AGES 55 TO 59 YEARS
0.3/ 100
METRIC RATING
253rd/ 347
METRIC RANK
4.7%
UNEMPLOYMENT AMONG AGES 55 TO 59 YEARS
94.7/ 100
METRIC RATING
99th/ 347
METRIC RANK
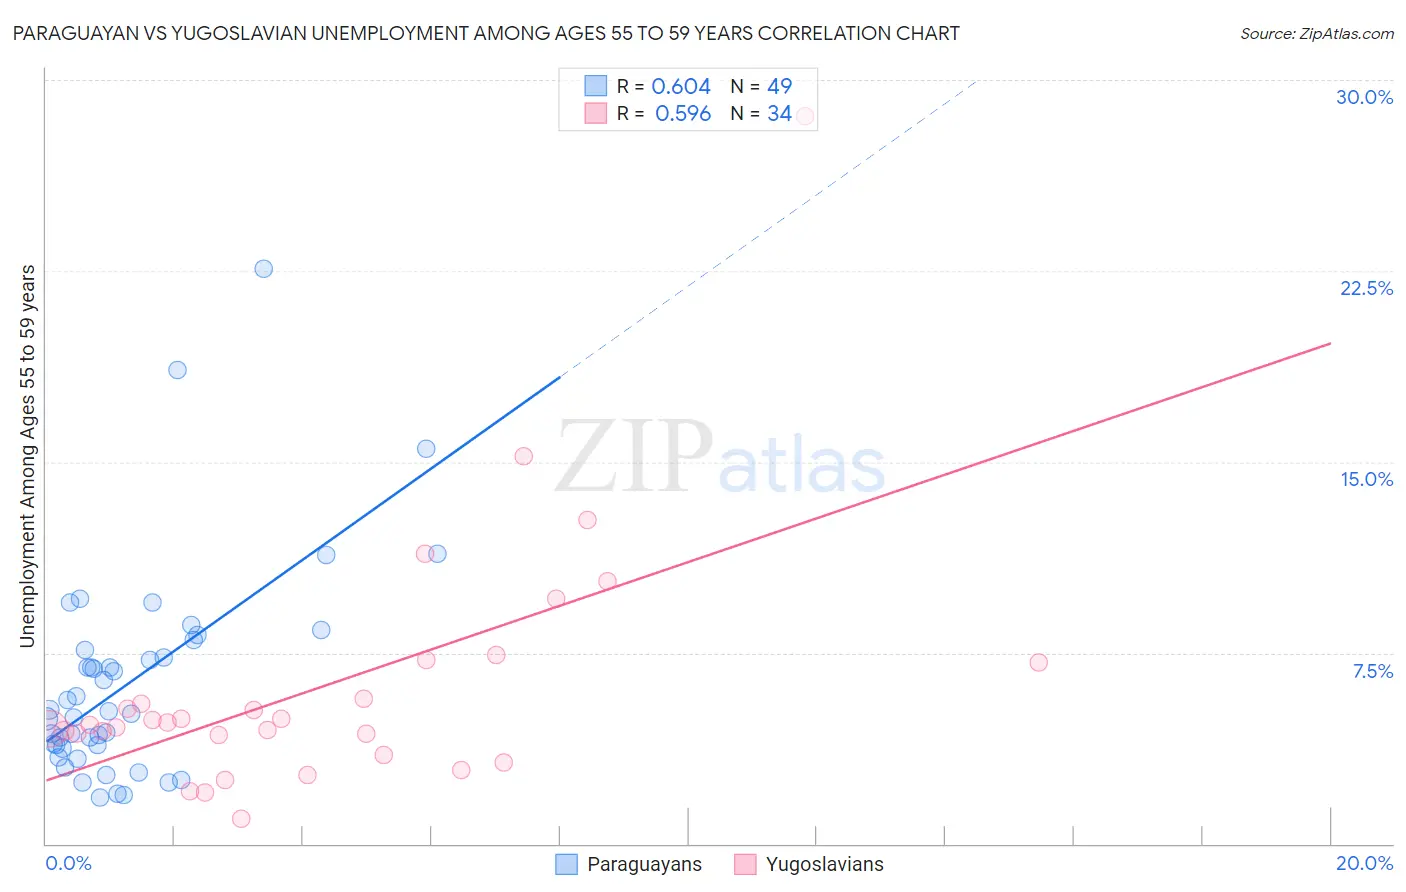
Paraguayan vs Yugoslavian Unemployment Among Ages 55 to 59 years Correlation Chart
The statistical analysis conducted on geographies consisting of 93,396,026 people shows a significant positive correlation between the proportion of Paraguayans and unemployment rate among population between the ages 55 and 59 in the United States with a correlation coefficient (R) of 0.604 and weighted average of 5.1%. Similarly, the statistical analysis conducted on geographies consisting of 270,151,356 people shows a substantial positive correlation between the proportion of Yugoslavians and unemployment rate among population between the ages 55 and 59 in the United States with a correlation coefficient (R) of 0.596 and weighted average of 4.7%, a difference of 9.0%.
Unemployment Among Ages 55 to 59 years Correlation Summary
| Measurement | Paraguayan | Yugoslavian |
| Minimum | 1.8% | 0.97% |
| Maximum | 22.6% | 28.6% |
| Range | 20.8% | 27.6% |
| Mean | 6.3% | 6.2% |
| Median | 5.2% | 4.7% |
| Interquartile 25% (IQ1) | 3.8% | 4.3% |
| Interquartile 75% (IQ3) | 7.8% | 7.1% |
| Interquartile Range (IQR) | 4.0% | 2.8% |
| Standard Deviation (Sample) | 4.1% | 5.0% |
| Standard Deviation (Population) | 4.1% | 5.0% |
Similar Demographics by Unemployment Among Ages 55 to 59 years
Demographics Similar to Paraguayans by Unemployment Among Ages 55 to 59 years
In terms of unemployment among ages 55 to 59 years, the demographic groups most similar to Paraguayans are Seminole (5.1%, a difference of 0.030%), U.S. Virgin Islander (5.1%, a difference of 0.040%), Portuguese (5.1%, a difference of 0.060%), Blackfeet (5.1%, a difference of 0.10%), and Cheyenne (5.1%, a difference of 0.13%).
| Demographics | Rating | Rank | Unemployment Among Ages 55 to 59 years |
| Immigrants | Greece | 0.6 /100 | #246 | Tragic 5.1% |
| Immigrants | Honduras | 0.5 /100 | #247 | Tragic 5.1% |
| Native Hawaiians | 0.5 /100 | #248 | Tragic 5.1% |
| Comanche | 0.4 /100 | #249 | Tragic 5.1% |
| Cheyenne | 0.4 /100 | #250 | Tragic 5.1% |
| Portuguese | 0.3 /100 | #251 | Tragic 5.1% |
| U.S. Virgin Islanders | 0.3 /100 | #252 | Tragic 5.1% |
| Paraguayans | 0.3 /100 | #253 | Tragic 5.1% |
| Seminole | 0.3 /100 | #254 | Tragic 5.1% |
| Blackfeet | 0.3 /100 | #255 | Tragic 5.1% |
| Senegalese | 0.3 /100 | #256 | Tragic 5.1% |
| Central Americans | 0.2 /100 | #257 | Tragic 5.1% |
| Salvadorans | 0.2 /100 | #258 | Tragic 5.1% |
| Immigrants | West Indies | 0.2 /100 | #259 | Tragic 5.1% |
| Immigrants | Western Africa | 0.2 /100 | #260 | Tragic 5.1% |
Demographics Similar to Yugoslavians by Unemployment Among Ages 55 to 59 years
In terms of unemployment among ages 55 to 59 years, the demographic groups most similar to Yugoslavians are Immigrants from Germany (4.7%, a difference of 0.020%), Immigrants from Canada (4.7%, a difference of 0.040%), Immigrants from Belgium (4.7%, a difference of 0.050%), Serbian (4.7%, a difference of 0.070%), and Celtic (4.7%, a difference of 0.090%).
| Demographics | Rating | Rank | Unemployment Among Ages 55 to 59 years |
| Iraqis | 96.1 /100 | #92 | Exceptional 4.7% |
| Immigrants | England | 95.8 /100 | #93 | Exceptional 4.7% |
| Immigrants | Scotland | 95.7 /100 | #94 | Exceptional 4.7% |
| South Africans | 95.6 /100 | #95 | Exceptional 4.7% |
| Immigrants | Belgium | 95.0 /100 | #96 | Exceptional 4.7% |
| Immigrants | Canada | 94.9 /100 | #97 | Exceptional 4.7% |
| Immigrants | Germany | 94.8 /100 | #98 | Exceptional 4.7% |
| Yugoslavians | 94.7 /100 | #99 | Exceptional 4.7% |
| Serbians | 94.4 /100 | #100 | Exceptional 4.7% |
| Celtics | 94.3 /100 | #101 | Exceptional 4.7% |
| Canadians | 94.1 /100 | #102 | Exceptional 4.7% |
| Immigrants | Oceania | 94.0 /100 | #103 | Exceptional 4.7% |
| Immigrants | Turkey | 93.9 /100 | #104 | Exceptional 4.7% |
| Immigrants | North America | 93.9 /100 | #105 | Exceptional 4.7% |
| Immigrants | Laos | 93.9 /100 | #106 | Exceptional 4.7% |