Panamanian vs Armenian Female Unemployment
COMPARE
Panamanian
Armenian
Female Unemployment
Female Unemployment Comparison
Panamanians
Armenians
5.5%
FEMALE UNEMPLOYMENT
4.7/ 100
METRIC RATING
229th/ 347
METRIC RANK
6.0%
FEMALE UNEMPLOYMENT
0.0/ 100
METRIC RATING
279th/ 347
METRIC RANK
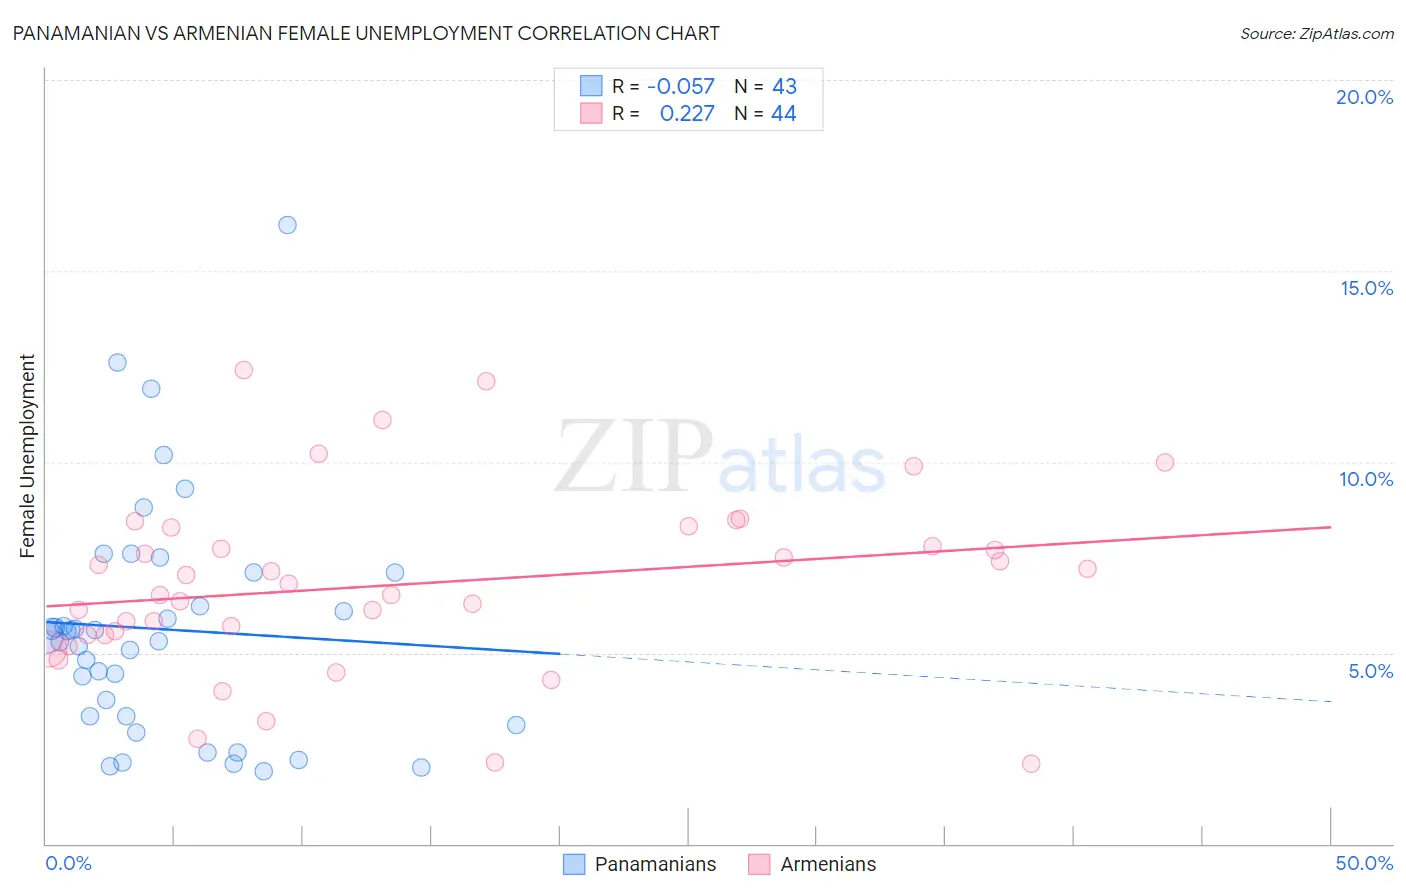
Panamanian vs Armenian Female Unemployment Correlation Chart
The statistical analysis conducted on geographies consisting of 280,650,516 people shows a slight negative correlation between the proportion of Panamanians and unemploymnet rate among females in the United States with a correlation coefficient (R) of -0.057 and weighted average of 5.5%. Similarly, the statistical analysis conducted on geographies consisting of 309,860,126 people shows a weak positive correlation between the proportion of Armenians and unemploymnet rate among females in the United States with a correlation coefficient (R) of 0.227 and weighted average of 6.0%, a difference of 9.4%.
Female Unemployment Correlation Summary
| Measurement | Panamanian | Armenian |
| Minimum | 1.9% | 2.1% |
| Maximum | 16.2% | 12.4% |
| Range | 14.3% | 10.3% |
| Mean | 5.6% | 6.8% |
| Median | 5.4% | 6.7% |
| Interquartile 25% (IQ1) | 3.3% | 5.5% |
| Interquartile 75% (IQ3) | 7.1% | 8.0% |
| Interquartile Range (IQR) | 3.8% | 2.6% |
| Standard Deviation (Sample) | 3.1% | 2.4% |
| Standard Deviation (Population) | 3.0% | 2.3% |
Similar Demographics by Female Unemployment
Demographics Similar to Panamanians by Female Unemployment
In terms of female unemployment, the demographic groups most similar to Panamanians are Israeli (5.5%, a difference of 0.010%), Immigrants from Uruguay (5.5%, a difference of 0.010%), Immigrants from Philippines (5.5%, a difference of 0.17%), Immigrants from Iraq (5.5%, a difference of 0.28%), and Liberian (5.5%, a difference of 0.29%).
| Demographics | Rating | Rank | Female Unemployment |
| Nicaraguans | 7.2 /100 | #222 | Tragic 5.5% |
| Delaware | 7.2 /100 | #223 | Tragic 5.5% |
| Iraqis | 7.1 /100 | #224 | Tragic 5.5% |
| French American Indians | 6.1 /100 | #225 | Tragic 5.5% |
| Immigrants | Peru | 5.9 /100 | #226 | Tragic 5.5% |
| Immigrants | Philippines | 5.3 /100 | #227 | Tragic 5.5% |
| Israelis | 4.8 /100 | #228 | Tragic 5.5% |
| Panamanians | 4.7 /100 | #229 | Tragic 5.5% |
| Immigrants | Uruguay | 4.7 /100 | #230 | Tragic 5.5% |
| Immigrants | Iraq | 3.9 /100 | #231 | Tragic 5.5% |
| Liberians | 3.9 /100 | #232 | Tragic 5.5% |
| Moroccans | 3.4 /100 | #233 | Tragic 5.5% |
| Immigrants | Lebanon | 3.3 /100 | #234 | Tragic 5.5% |
| Immigrants | Iran | 3.3 /100 | #235 | Tragic 5.5% |
| Immigrants | Cambodia | 3.3 /100 | #236 | Tragic 5.5% |
Demographics Similar to Armenians by Female Unemployment
In terms of female unemployment, the demographic groups most similar to Armenians are Mexican American Indian (6.0%, a difference of 0.060%), Guatemalan (6.0%, a difference of 0.090%), Yaqui (6.0%, a difference of 0.11%), Immigrants from Ghana (6.0%, a difference of 0.12%), and Colville (6.0%, a difference of 0.37%).
| Demographics | Rating | Rank | Female Unemployment |
| Lumbee | 0.0 /100 | #272 | Tragic 5.9% |
| Ghanaians | 0.0 /100 | #273 | Tragic 5.9% |
| Africans | 0.0 /100 | #274 | Tragic 5.9% |
| Senegalese | 0.0 /100 | #275 | Tragic 6.0% |
| Bahamians | 0.0 /100 | #276 | Tragic 6.0% |
| Immigrants | Ghana | 0.0 /100 | #277 | Tragic 6.0% |
| Yaqui | 0.0 /100 | #278 | Tragic 6.0% |
| Armenians | 0.0 /100 | #279 | Tragic 6.0% |
| Mexican American Indians | 0.0 /100 | #280 | Tragic 6.0% |
| Guatemalans | 0.0 /100 | #281 | Tragic 6.0% |
| Colville | 0.0 /100 | #282 | Tragic 6.0% |
| Salvadorans | 0.0 /100 | #283 | Tragic 6.0% |
| Immigrants | Senegal | 0.0 /100 | #284 | Tragic 6.1% |
| Immigrants | Cabo Verde | 0.0 /100 | #285 | Tragic 6.1% |
| Chippewa | 0.0 /100 | #286 | Tragic 6.1% |