Pima vs Immigrants from Fiji Unemployment Among Ages 60 to 64 years
COMPARE
Pima
Immigrants from Fiji
Unemployment Among Ages 60 to 64 years
Unemployment Among Ages 60 to 64 years Comparison
Pima
Immigrants from Fiji
4.8%
UNEMPLOYMENT AMONG AGES 60 TO 64 YEARS
85.8/ 100
METRIC RATING
140th/ 347
METRIC RANK
5.1%
UNEMPLOYMENT AMONG AGES 60 TO 64 YEARS
1.1/ 100
METRIC RATING
248th/ 347
METRIC RANK
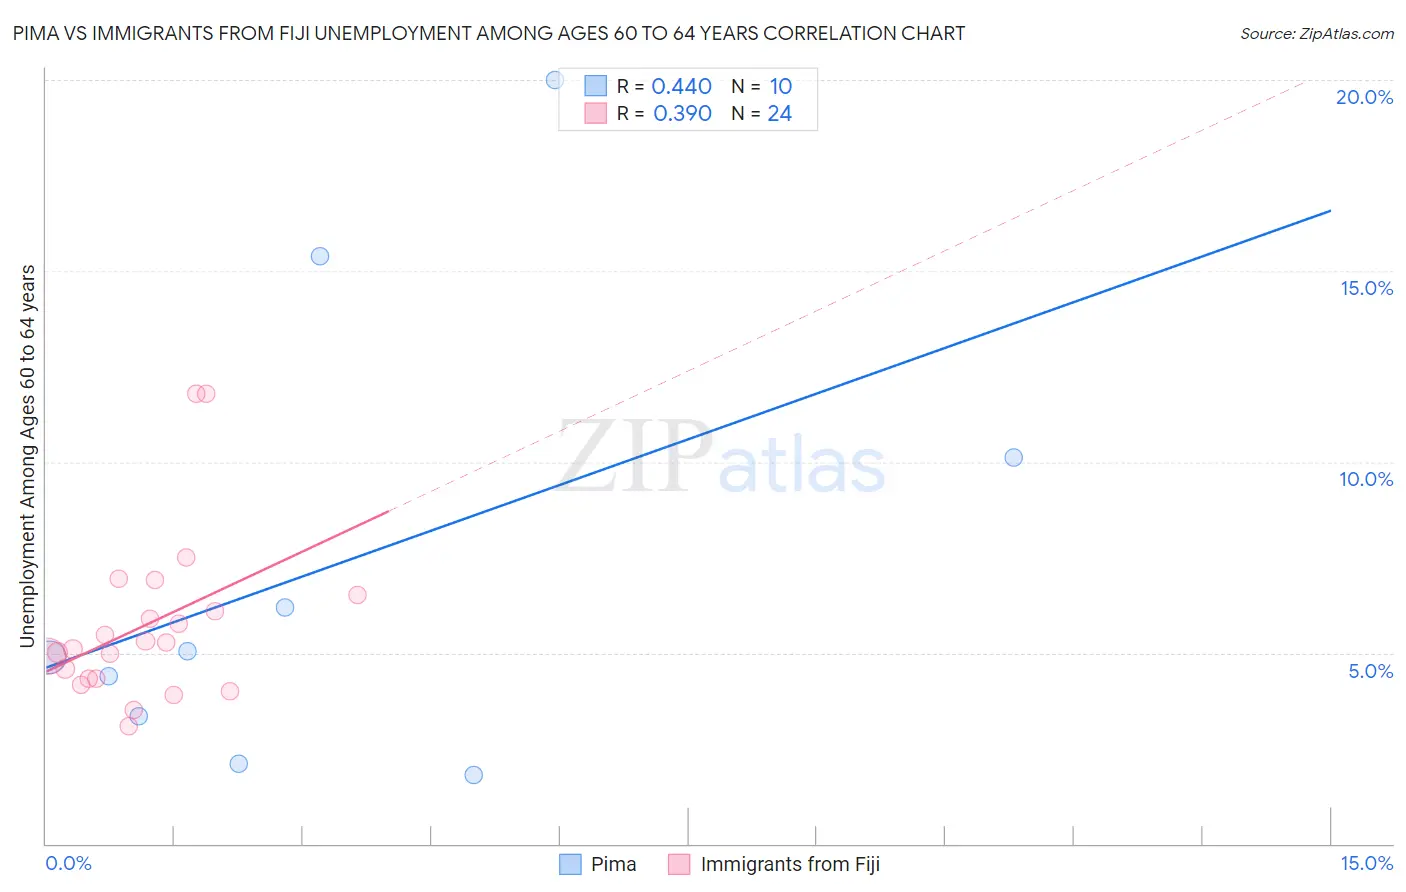
Pima vs Immigrants from Fiji Unemployment Among Ages 60 to 64 years Correlation Chart
The statistical analysis conducted on geographies consisting of 60,148,885 people shows a moderate positive correlation between the proportion of Pima and unemployment rate among population between the ages 60 and 64 in the United States with a correlation coefficient (R) of 0.440 and weighted average of 4.8%. Similarly, the statistical analysis conducted on geographies consisting of 91,801,699 people shows a mild positive correlation between the proportion of Immigrants from Fiji and unemployment rate among population between the ages 60 and 64 in the United States with a correlation coefficient (R) of 0.390 and weighted average of 5.1%, a difference of 5.7%.
Unemployment Among Ages 60 to 64 years Correlation Summary
| Measurement | Pima | Immigrants from Fiji |
| Minimum | 1.8% | 3.1% |
| Maximum | 20.0% | 11.8% |
| Range | 18.2% | 8.7% |
| Mean | 7.3% | 5.7% |
| Median | 5.0% | 5.2% |
| Interquartile 25% (IQ1) | 3.3% | 4.3% |
| Interquartile 75% (IQ3) | 10.1% | 6.3% |
| Interquartile Range (IQR) | 6.8% | 2.0% |
| Standard Deviation (Sample) | 6.0% | 2.2% |
| Standard Deviation (Population) | 5.7% | 2.1% |
Similar Demographics by Unemployment Among Ages 60 to 64 years
Demographics Similar to Pima by Unemployment Among Ages 60 to 64 years
In terms of unemployment among ages 60 to 64 years, the demographic groups most similar to Pima are Panamanian (4.8%, a difference of 0.020%), Immigrants from Ethiopia (4.8%, a difference of 0.030%), Immigrants from Africa (4.8%, a difference of 0.060%), Italian (4.8%, a difference of 0.060%), and Immigrants from Lithuania (4.8%, a difference of 0.070%).
| Demographics | Rating | Rank | Unemployment Among Ages 60 to 64 years |
| Yaqui | 89.5 /100 | #133 | Excellent 4.8% |
| Basques | 88.8 /100 | #134 | Excellent 4.8% |
| Pennsylvania Germans | 87.8 /100 | #135 | Excellent 4.8% |
| French Canadians | 87.6 /100 | #136 | Excellent 4.8% |
| Cambodians | 86.9 /100 | #137 | Excellent 4.8% |
| Immigrants | Lithuania | 86.7 /100 | #138 | Excellent 4.8% |
| Immigrants | Africa | 86.6 /100 | #139 | Excellent 4.8% |
| Pima | 85.8 /100 | #140 | Excellent 4.8% |
| Panamanians | 85.5 /100 | #141 | Excellent 4.8% |
| Immigrants | Ethiopia | 85.3 /100 | #142 | Excellent 4.8% |
| Italians | 85.0 /100 | #143 | Excellent 4.8% |
| Immigrants | Pakistan | 83.3 /100 | #144 | Excellent 4.8% |
| Burmese | 83.1 /100 | #145 | Excellent 4.8% |
| Turks | 81.9 /100 | #146 | Excellent 4.8% |
| Mongolians | 81.2 /100 | #147 | Excellent 4.8% |
Demographics Similar to Immigrants from Fiji by Unemployment Among Ages 60 to 64 years
In terms of unemployment among ages 60 to 64 years, the demographic groups most similar to Immigrants from Fiji are South American (5.1%, a difference of 0.030%), Immigrants from South America (5.0%, a difference of 0.050%), Immigrants from North Macedonia (5.0%, a difference of 0.050%), Immigrants from Cambodia (5.1%, a difference of 0.12%), and Immigrants from Uruguay (5.1%, a difference of 0.15%).
| Demographics | Rating | Rank | Unemployment Among Ages 60 to 64 years |
| Indians (Asian) | 2.2 /100 | #241 | Tragic 5.0% |
| Argentineans | 2.1 /100 | #242 | Tragic 5.0% |
| Immigrants | Philippines | 1.9 /100 | #243 | Tragic 5.0% |
| Peruvians | 1.6 /100 | #244 | Tragic 5.0% |
| Comanche | 1.3 /100 | #245 | Tragic 5.0% |
| Immigrants | South America | 1.1 /100 | #246 | Tragic 5.0% |
| Immigrants | North Macedonia | 1.1 /100 | #247 | Tragic 5.0% |
| Immigrants | Fiji | 1.1 /100 | #248 | Tragic 5.1% |
| South Americans | 1.0 /100 | #249 | Tragic 5.1% |
| Immigrants | Cambodia | 0.9 /100 | #250 | Tragic 5.1% |
| Immigrants | Uruguay | 0.9 /100 | #251 | Tragic 5.1% |
| Immigrants | Switzerland | 0.9 /100 | #252 | Tragic 5.1% |
| Immigrants | China | 0.9 /100 | #253 | Tragic 5.1% |
| Costa Ricans | 0.8 /100 | #254 | Tragic 5.1% |
| Estonians | 0.8 /100 | #255 | Tragic 5.1% |