Palestinian vs Pennsylvania German Unemployment Among Ages 65 to 74 years
COMPARE
Palestinian
Pennsylvania German
Unemployment Among Ages 65 to 74 years
Unemployment Among Ages 65 to 74 years Comparison
Palestinians
Pennsylvania Germans
5.0%
UNEMPLOYMENT AMONG AGES 65 TO 74 YEARS
100.0/ 100
METRIC RATING
32nd/ 347
METRIC RANK
5.8%
UNEMPLOYMENT AMONG AGES 65 TO 74 YEARS
0.0/ 100
METRIC RATING
296th/ 347
METRIC RANK
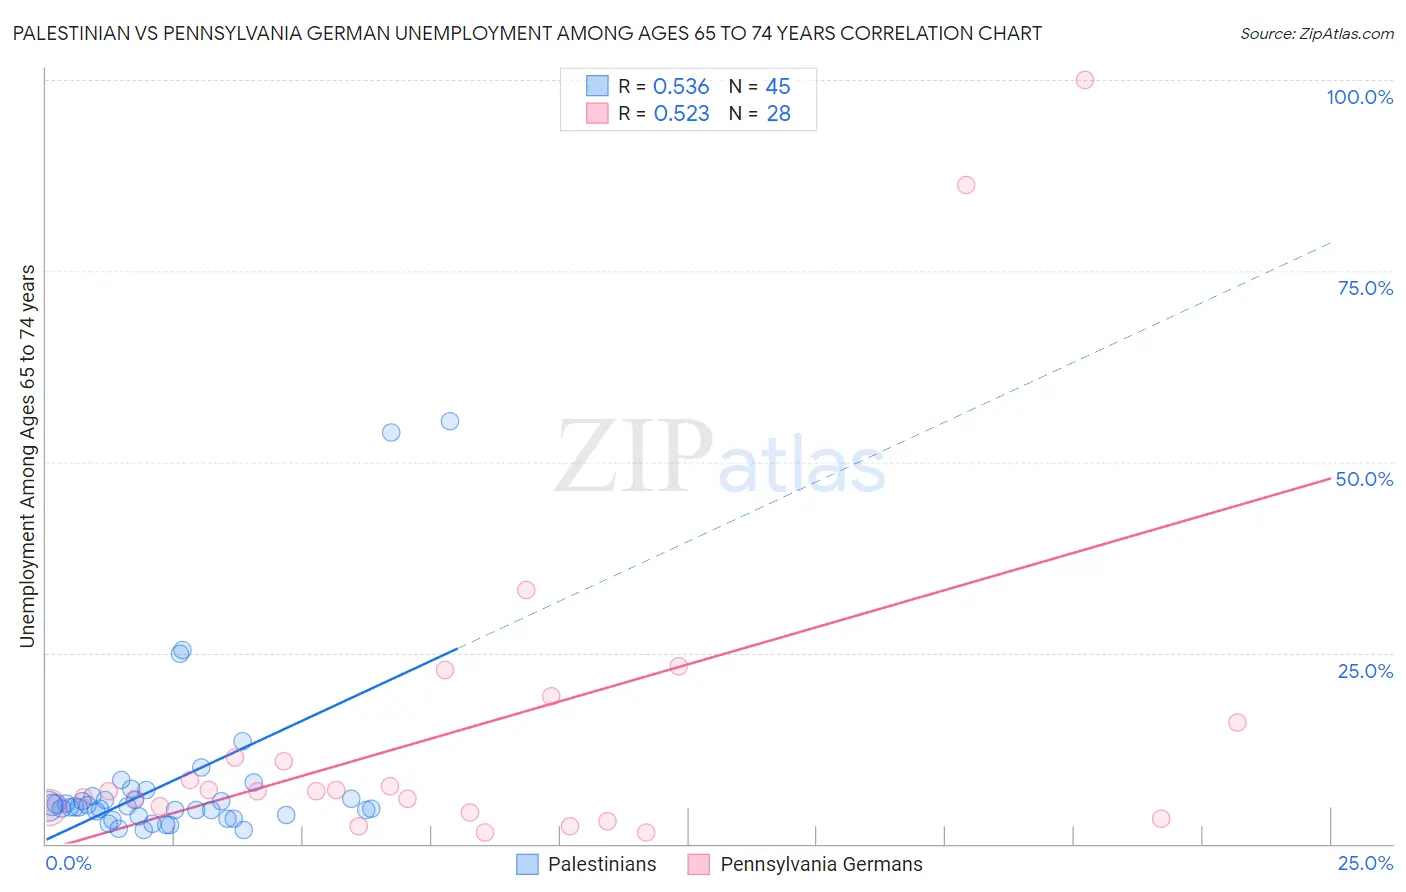
Palestinian vs Pennsylvania German Unemployment Among Ages 65 to 74 years Correlation Chart
The statistical analysis conducted on geographies consisting of 204,086,595 people shows a substantial positive correlation between the proportion of Palestinians and unemployment rate among population between the ages 65 and 74 in the United States with a correlation coefficient (R) of 0.536 and weighted average of 5.0%. Similarly, the statistical analysis conducted on geographies consisting of 205,280,371 people shows a substantial positive correlation between the proportion of Pennsylvania Germans and unemployment rate among population between the ages 65 and 74 in the United States with a correlation coefficient (R) of 0.523 and weighted average of 5.8%, a difference of 15.6%.
Unemployment Among Ages 65 to 74 years Correlation Summary
| Measurement | Palestinian | Pennsylvania German |
| Minimum | 1.8% | 1.4% |
| Maximum | 55.4% | 100.0% |
| Range | 53.6% | 98.6% |
| Mean | 8.0% | 15.0% |
| Median | 4.8% | 6.9% |
| Interquartile 25% (IQ1) | 3.7% | 4.4% |
| Interquartile 75% (IQ3) | 6.1% | 13.6% |
| Interquartile Range (IQR) | 2.4% | 9.2% |
| Standard Deviation (Sample) | 11.2% | 23.4% |
| Standard Deviation (Population) | 11.1% | 23.0% |
Similar Demographics by Unemployment Among Ages 65 to 74 years
Demographics Similar to Palestinians by Unemployment Among Ages 65 to 74 years
In terms of unemployment among ages 65 to 74 years, the demographic groups most similar to Palestinians are Belgian (5.0%, a difference of 0.050%), Cambodian (5.0%, a difference of 0.060%), Bhutanese (5.0%, a difference of 0.17%), Slovene (5.0%, a difference of 0.28%), and Immigrants from Kuwait (5.0%, a difference of 0.36%).
| Demographics | Rating | Rank | Unemployment Among Ages 65 to 74 years |
| Macedonians | 100.0 /100 | #25 | Exceptional 5.0% |
| Czechs | 100.0 /100 | #26 | Exceptional 5.0% |
| Norwegians | 100.0 /100 | #27 | Exceptional 5.0% |
| Bulgarians | 100.0 /100 | #28 | Exceptional 5.0% |
| Ethiopians | 100.0 /100 | #29 | Exceptional 5.0% |
| Immigrants | Lebanon | 100.0 /100 | #30 | Exceptional 5.0% |
| Slovenes | 100.0 /100 | #31 | Exceptional 5.0% |
| Palestinians | 100.0 /100 | #32 | Exceptional 5.0% |
| Belgians | 100.0 /100 | #33 | Exceptional 5.0% |
| Cambodians | 100.0 /100 | #34 | Exceptional 5.0% |
| Bhutanese | 100.0 /100 | #35 | Exceptional 5.0% |
| Immigrants | Kuwait | 99.9 /100 | #36 | Exceptional 5.0% |
| Immigrants | Eastern Africa | 99.9 /100 | #37 | Exceptional 5.0% |
| Nepalese | 99.9 /100 | #38 | Exceptional 5.0% |
| Immigrants | Sweden | 99.9 /100 | #39 | Exceptional 5.0% |
Demographics Similar to Pennsylvania Germans by Unemployment Among Ages 65 to 74 years
In terms of unemployment among ages 65 to 74 years, the demographic groups most similar to Pennsylvania Germans are Houma (5.8%, a difference of 0.17%), Immigrants from Latin America (5.8%, a difference of 0.36%), Barbadian (5.8%, a difference of 0.37%), Ecuadorian (5.8%, a difference of 0.38%), and Black/African American (5.8%, a difference of 0.46%).
| Demographics | Rating | Rank | Unemployment Among Ages 65 to 74 years |
| Immigrants | Somalia | 0.0 /100 | #289 | Tragic 5.7% |
| Spanish American Indians | 0.0 /100 | #290 | Tragic 5.7% |
| Portuguese | 0.0 /100 | #291 | Tragic 5.7% |
| U.S. Virgin Islanders | 0.0 /100 | #292 | Tragic 5.8% |
| Immigrants | Grenada | 0.0 /100 | #293 | Tragic 5.8% |
| Immigrants | Morocco | 0.0 /100 | #294 | Tragic 5.8% |
| Blacks/African Americans | 0.0 /100 | #295 | Tragic 5.8% |
| Pennsylvania Germans | 0.0 /100 | #296 | Tragic 5.8% |
| Houma | 0.0 /100 | #297 | Tragic 5.8% |
| Immigrants | Latin America | 0.0 /100 | #298 | Tragic 5.8% |
| Barbadians | 0.0 /100 | #299 | Tragic 5.8% |
| Ecuadorians | 0.0 /100 | #300 | Tragic 5.8% |
| Armenians | 0.0 /100 | #301 | Tragic 5.8% |
| Liberians | 0.0 /100 | #302 | Tragic 5.8% |
| Arapaho | 0.0 /100 | #303 | Tragic 5.8% |