Palestinian vs Immigrants from Ecuador Unemployment
COMPARE
Palestinian
Immigrants from Ecuador
Unemployment
Unemployment Comparison
Palestinians
Immigrants from Ecuador
5.1%
UNEMPLOYMENT
83.4/ 100
METRIC RATING
141st/ 347
METRIC RANK
6.2%
UNEMPLOYMENT
0.0/ 100
METRIC RATING
293rd/ 347
METRIC RANK
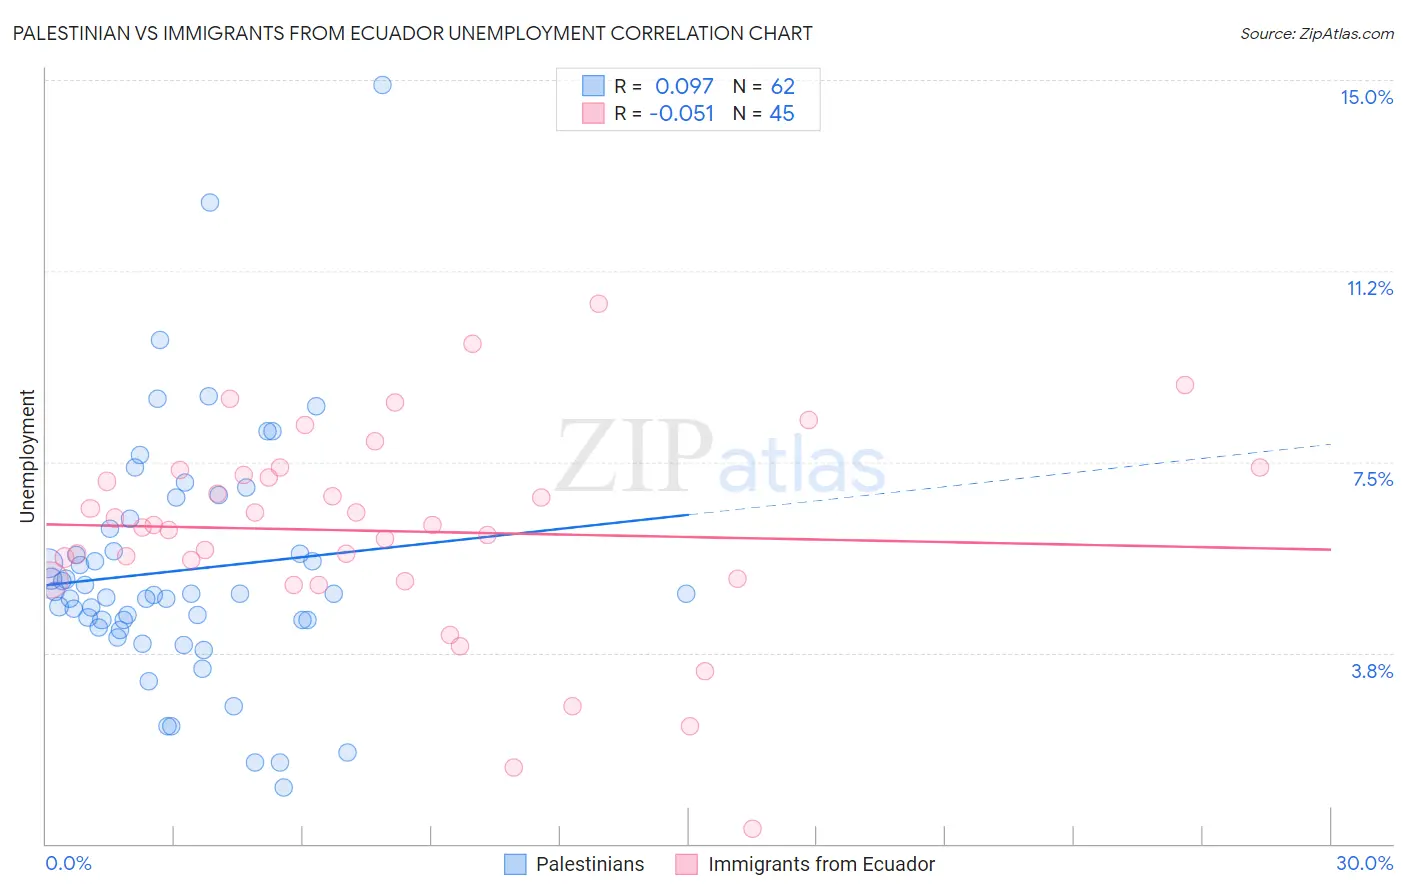
Palestinian vs Immigrants from Ecuador Unemployment Correlation Chart
The statistical analysis conducted on geographies consisting of 216,422,149 people shows a slight positive correlation between the proportion of Palestinians and unemployment in the United States with a correlation coefficient (R) of 0.097 and weighted average of 5.1%. Similarly, the statistical analysis conducted on geographies consisting of 270,858,036 people shows a slight negative correlation between the proportion of Immigrants from Ecuador and unemployment in the United States with a correlation coefficient (R) of -0.051 and weighted average of 6.2%, a difference of 21.7%.
Unemployment Correlation Summary
| Measurement | Palestinian | Immigrants from Ecuador |
| Minimum | 1.1% | 0.30% |
| Maximum | 14.9% | 10.6% |
| Range | 13.8% | 10.3% |
| Mean | 5.4% | 6.1% |
| Median | 4.9% | 6.3% |
| Interquartile 25% (IQ1) | 4.4% | 5.2% |
| Interquartile 75% (IQ3) | 6.2% | 7.3% |
| Interquartile Range (IQR) | 1.8% | 2.1% |
| Standard Deviation (Sample) | 2.4% | 2.0% |
| Standard Deviation (Population) | 2.4% | 2.0% |
Similar Demographics by Unemployment
Demographics Similar to Palestinians by Unemployment
In terms of unemployment, the demographic groups most similar to Palestinians are Immigrants from Pakistan (5.1%, a difference of 0.020%), Immigrants from Chile (5.1%, a difference of 0.070%), Immigrants from Denmark (5.1%, a difference of 0.11%), Indonesian (5.1%, a difference of 0.12%), and Immigrants from Norway (5.1%, a difference of 0.17%).
| Demographics | Rating | Rank | Unemployment |
| Immigrants | Europe | 86.3 /100 | #134 | Excellent 5.1% |
| Immigrants | Burma/Myanmar | 86.2 /100 | #135 | Excellent 5.1% |
| Immigrants | Spain | 86.2 /100 | #136 | Excellent 5.1% |
| Immigrants | Saudi Arabia | 85.6 /100 | #137 | Excellent 5.1% |
| Immigrants | Hungary | 85.6 /100 | #138 | Excellent 5.1% |
| Pakistanis | 85.3 /100 | #139 | Excellent 5.1% |
| Immigrants | Denmark | 84.3 /100 | #140 | Excellent 5.1% |
| Palestinians | 83.4 /100 | #141 | Excellent 5.1% |
| Immigrants | Pakistan | 83.2 /100 | #142 | Excellent 5.1% |
| Immigrants | Chile | 82.8 /100 | #143 | Excellent 5.1% |
| Indonesians | 82.3 /100 | #144 | Excellent 5.1% |
| Immigrants | Norway | 81.8 /100 | #145 | Excellent 5.1% |
| Immigrants | Asia | 81.8 /100 | #146 | Excellent 5.1% |
| Indians (Asian) | 81.6 /100 | #147 | Excellent 5.1% |
| Immigrants | Italy | 79.1 /100 | #148 | Good 5.1% |
Demographics Similar to Immigrants from Ecuador by Unemployment
In terms of unemployment, the demographic groups most similar to Immigrants from Ecuador are Spanish American Indian (6.2%, a difference of 0.0%), Central American Indian (6.2%, a difference of 0.090%), Haitian (6.2%, a difference of 0.11%), U.S. Virgin Islander (6.3%, a difference of 0.12%), and Ute (6.3%, a difference of 0.57%).
| Demographics | Rating | Rank | Unemployment |
| Immigrants | Caribbean | 0.0 /100 | #286 | Tragic 6.2% |
| Nepalese | 0.0 /100 | #287 | Tragic 6.2% |
| Ecuadorians | 0.0 /100 | #288 | Tragic 6.2% |
| Chippewa | 0.0 /100 | #289 | Tragic 6.2% |
| Senegalese | 0.0 /100 | #290 | Tragic 6.2% |
| Haitians | 0.0 /100 | #291 | Tragic 6.2% |
| Central American Indians | 0.0 /100 | #292 | Tragic 6.2% |
| Immigrants | Ecuador | 0.0 /100 | #293 | Tragic 6.2% |
| Spanish American Indians | 0.0 /100 | #294 | Tragic 6.2% |
| U.S. Virgin Islanders | 0.0 /100 | #295 | Tragic 6.3% |
| Ute | 0.0 /100 | #296 | Tragic 6.3% |
| Jamaicans | 0.0 /100 | #297 | Tragic 6.3% |
| Immigrants | Haiti | 0.0 /100 | #298 | Tragic 6.3% |
| Immigrants | West Indies | 0.0 /100 | #299 | Tragic 6.3% |
| Immigrants | Trinidad and Tobago | 0.0 /100 | #300 | Tragic 6.3% |