Pakistani vs Immigrants from Sierra Leone Male Unemployment
COMPARE
Pakistani
Immigrants from Sierra Leone
Male Unemployment
Male Unemployment Comparison
Pakistanis
Immigrants from Sierra Leone
5.2%
MALE UNEMPLOYMENT
80.5/ 100
METRIC RATING
134th/ 347
METRIC RANK
6.0%
MALE UNEMPLOYMENT
0.0/ 100
METRIC RATING
274th/ 347
METRIC RANK
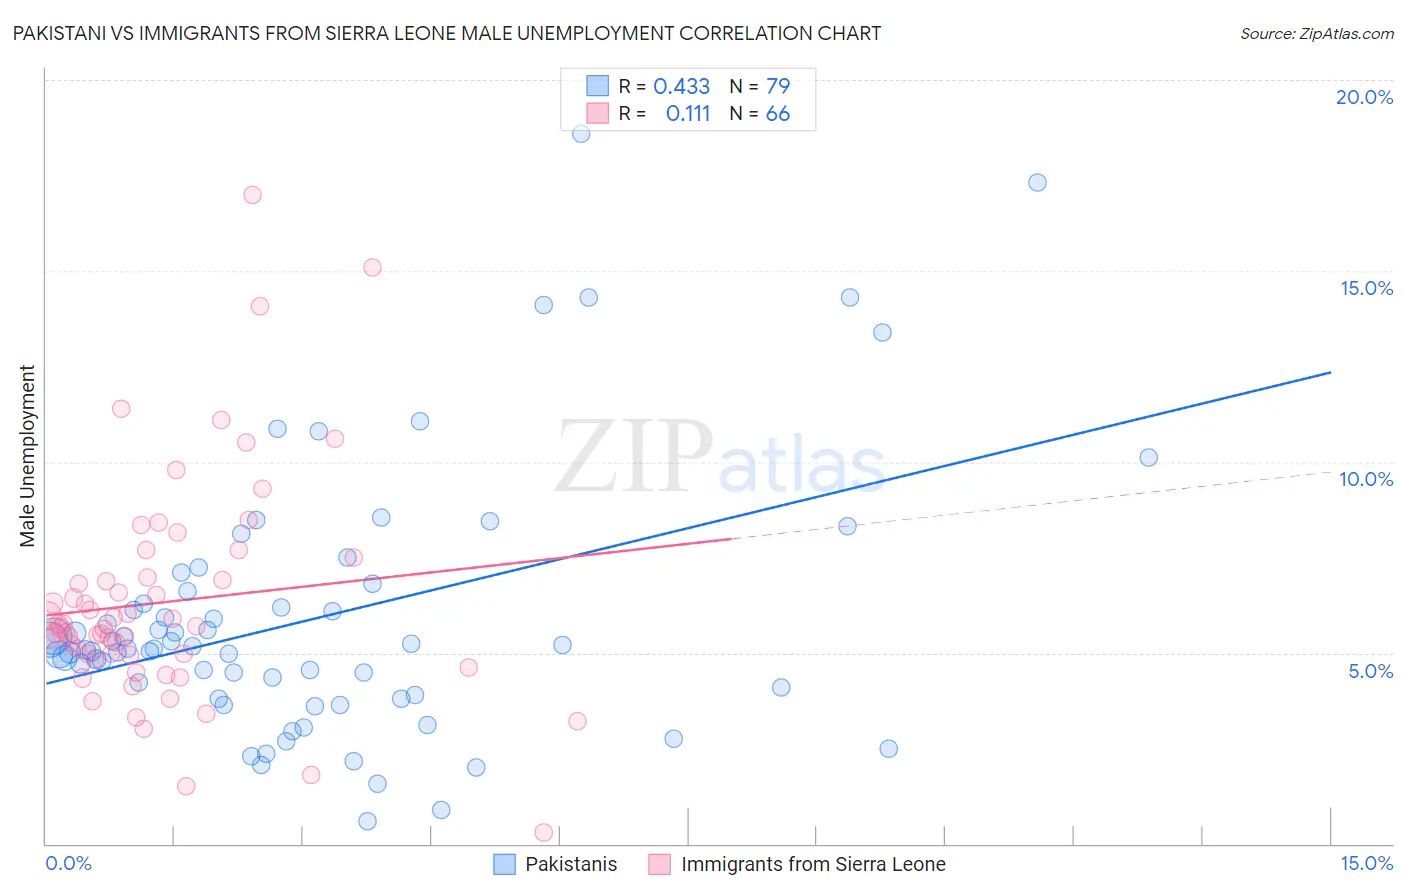
Pakistani vs Immigrants from Sierra Leone Male Unemployment Correlation Chart
The statistical analysis conducted on geographies consisting of 334,491,221 people shows a moderate positive correlation between the proportion of Pakistanis and unemployment rate among males in the United States with a correlation coefficient (R) of 0.433 and weighted average of 5.2%. Similarly, the statistical analysis conducted on geographies consisting of 101,591,939 people shows a poor positive correlation between the proportion of Immigrants from Sierra Leone and unemployment rate among males in the United States with a correlation coefficient (R) of 0.111 and weighted average of 6.0%, a difference of 16.0%.
Male Unemployment Correlation Summary
| Measurement | Pakistani | Immigrants from Sierra Leone |
| Minimum | 0.60% | 0.30% |
| Maximum | 18.6% | 17.0% |
| Range | 18.0% | 16.7% |
| Mean | 5.9% | 6.3% |
| Median | 5.1% | 5.7% |
| Interquartile 25% (IQ1) | 3.9% | 4.9% |
| Interquartile 75% (IQ3) | 6.6% | 7.0% |
| Interquartile Range (IQR) | 2.7% | 2.0% |
| Standard Deviation (Sample) | 3.5% | 2.9% |
| Standard Deviation (Population) | 3.5% | 2.9% |
Similar Demographics by Male Unemployment
Demographics Similar to Pakistanis by Male Unemployment
In terms of male unemployment, the demographic groups most similar to Pakistanis are Immigrants from Saudi Arabia (5.2%, a difference of 0.030%), Lebanese (5.2%, a difference of 0.050%), Colombian (5.2%, a difference of 0.060%), Immigrants from Eastern Africa (5.2%, a difference of 0.060%), and Immigrants from Croatia (5.2%, a difference of 0.070%).
| Demographics | Rating | Rank | Male Unemployment |
| Immigrants | Brazil | 86.3 /100 | #127 | Excellent 5.2% |
| Hungarians | 85.1 /100 | #128 | Excellent 5.2% |
| Immigrants | Western Europe | 84.8 /100 | #129 | Excellent 5.2% |
| Immigrants | Malaysia | 83.5 /100 | #130 | Excellent 5.2% |
| Immigrants | Germany | 83.0 /100 | #131 | Excellent 5.2% |
| Chickasaw | 82.9 /100 | #132 | Excellent 5.2% |
| Colombians | 81.1 /100 | #133 | Excellent 5.2% |
| Pakistanis | 80.5 /100 | #134 | Excellent 5.2% |
| Immigrants | Saudi Arabia | 80.1 /100 | #135 | Excellent 5.2% |
| Lebanese | 79.9 /100 | #136 | Good 5.2% |
| Immigrants | Eastern Africa | 79.8 /100 | #137 | Good 5.2% |
| Immigrants | Croatia | 79.7 /100 | #138 | Good 5.2% |
| Kenyans | 79.4 /100 | #139 | Good 5.2% |
| Brazilians | 79.3 /100 | #140 | Good 5.2% |
| Immigrants | Switzerland | 79.2 /100 | #141 | Good 5.2% |
Demographics Similar to Immigrants from Sierra Leone by Male Unemployment
In terms of male unemployment, the demographic groups most similar to Immigrants from Sierra Leone are Menominee (6.0%, a difference of 0.15%), Armenian (6.0%, a difference of 0.17%), Immigrants from Uzbekistan (6.0%, a difference of 0.18%), Tlingit-Haida (6.0%, a difference of 0.25%), and Blackfeet (6.0%, a difference of 0.41%).
| Demographics | Rating | Rank | Male Unemployment |
| Nigerians | 0.0 /100 | #267 | Tragic 5.9% |
| Bermudans | 0.0 /100 | #268 | Tragic 5.9% |
| Immigrants | Nigeria | 0.0 /100 | #269 | Tragic 6.0% |
| Sub-Saharan Africans | 0.0 /100 | #270 | Tragic 6.0% |
| Blackfeet | 0.0 /100 | #271 | Tragic 6.0% |
| Immigrants | Uzbekistan | 0.0 /100 | #272 | Tragic 6.0% |
| Armenians | 0.0 /100 | #273 | Tragic 6.0% |
| Immigrants | Sierra Leone | 0.0 /100 | #274 | Tragic 6.0% |
| Menominee | 0.0 /100 | #275 | Tragic 6.0% |
| Tlingit-Haida | 0.0 /100 | #276 | Tragic 6.0% |
| Immigrants | Liberia | 0.0 /100 | #277 | Tragic 6.1% |
| Immigrants | Fiji | 0.0 /100 | #278 | Tragic 6.1% |
| Ghanaians | 0.0 /100 | #279 | Tragic 6.1% |
| Immigrants | Ghana | 0.0 /100 | #280 | Tragic 6.2% |
| Sierra Leoneans | 0.0 /100 | #281 | Tragic 6.2% |