Paiute vs Immigrants from South Central Asia Male Unemployment
COMPARE
Paiute
Immigrants from South Central Asia
Male Unemployment
Male Unemployment Comparison
Paiute
Immigrants from South Central Asia
7.7%
MALE UNEMPLOYMENT
0.0/ 100
METRIC RATING
327th/ 347
METRIC RANK
4.8%
MALE UNEMPLOYMENT
99.9/ 100
METRIC RATING
24th/ 347
METRIC RANK
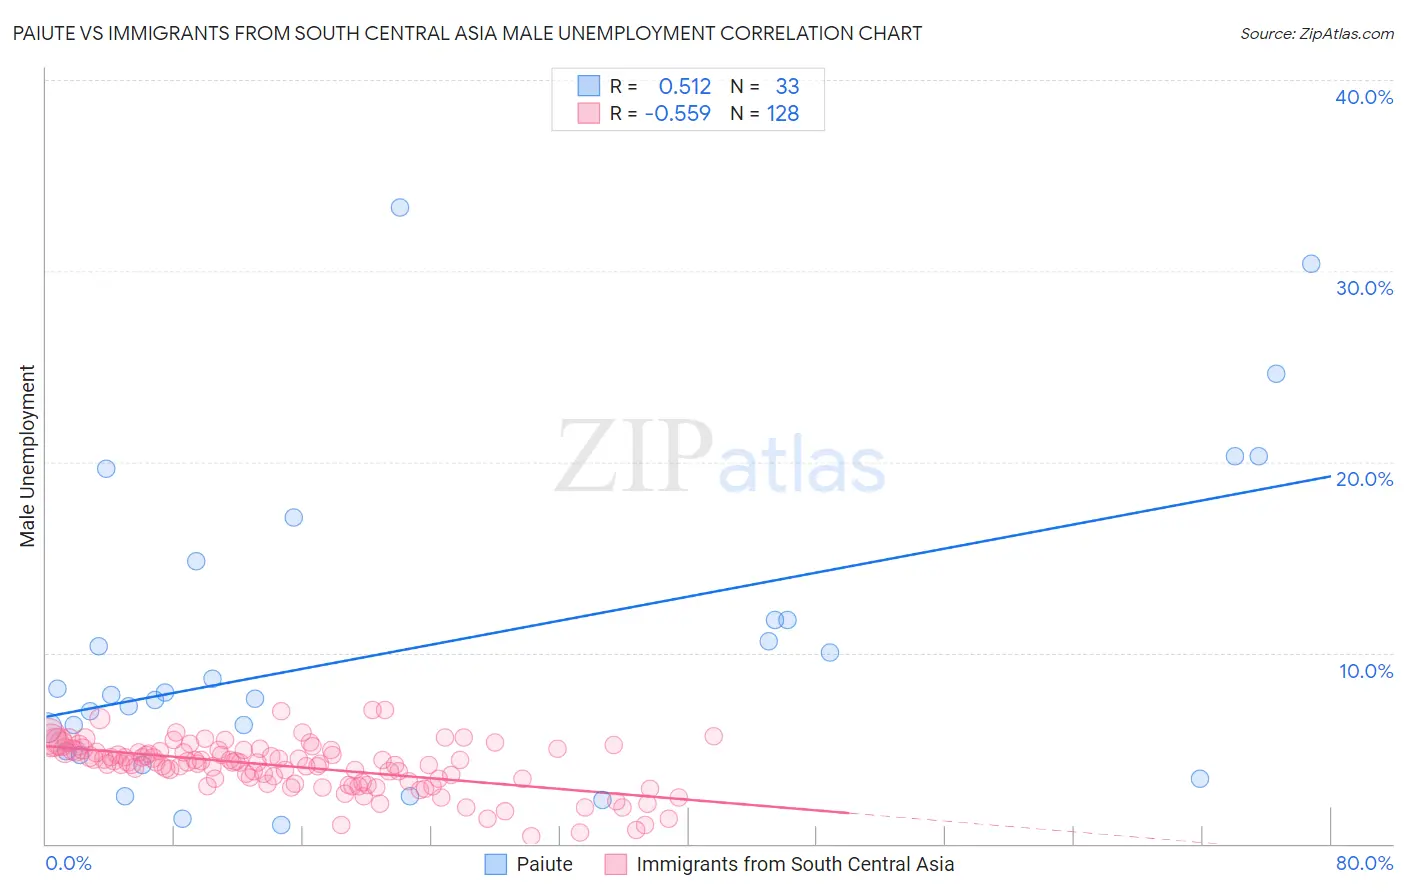
Paiute vs Immigrants from South Central Asia Male Unemployment Correlation Chart
The statistical analysis conducted on geographies consisting of 58,346,230 people shows a substantial positive correlation between the proportion of Paiute and unemployment rate among males in the United States with a correlation coefficient (R) of 0.512 and weighted average of 7.7%. Similarly, the statistical analysis conducted on geographies consisting of 470,335,187 people shows a substantial negative correlation between the proportion of Immigrants from South Central Asia and unemployment rate among males in the United States with a correlation coefficient (R) of -0.559 and weighted average of 4.8%, a difference of 61.1%.
Male Unemployment Correlation Summary
| Measurement | Paiute | Immigrants from South Central Asia |
| Minimum | 1.0% | 0.40% |
| Maximum | 33.3% | 7.0% |
| Range | 32.3% | 6.6% |
| Mean | 10.4% | 4.0% |
| Median | 7.8% | 4.2% |
| Interquartile 25% (IQ1) | 4.8% | 3.2% |
| Interquartile 75% (IQ3) | 13.3% | 4.9% |
| Interquartile Range (IQR) | 8.5% | 1.7% |
| Standard Deviation (Sample) | 8.1% | 1.3% |
| Standard Deviation (Population) | 8.0% | 1.3% |
Similar Demographics by Male Unemployment
Demographics Similar to Paiute by Male Unemployment
In terms of male unemployment, the demographic groups most similar to Paiute are Native/Alaskan (7.7%, a difference of 0.38%), Immigrants from Dominican Republic (7.6%, a difference of 1.1%), Shoshone (7.6%, a difference of 1.2%), Immigrants from Yemen (7.8%, a difference of 1.3%), and Dominican (7.6%, a difference of 1.6%).
| Demographics | Rating | Rank | Male Unemployment |
| Colville | 0.0 /100 | #320 | Tragic 7.4% |
| Immigrants | St. Vincent and the Grenadines | 0.0 /100 | #321 | Tragic 7.5% |
| Immigrants | Cabo Verde | 0.0 /100 | #322 | Tragic 7.5% |
| Immigrants | Grenada | 0.0 /100 | #323 | Tragic 7.6% |
| Dominicans | 0.0 /100 | #324 | Tragic 7.6% |
| Shoshone | 0.0 /100 | #325 | Tragic 7.6% |
| Immigrants | Dominican Republic | 0.0 /100 | #326 | Tragic 7.6% |
| Paiute | 0.0 /100 | #327 | Tragic 7.7% |
| Natives/Alaskans | 0.0 /100 | #328 | Tragic 7.7% |
| Immigrants | Yemen | 0.0 /100 | #329 | Tragic 7.8% |
| Yakama | 0.0 /100 | #330 | Tragic 7.9% |
| Alaska Natives | 0.0 /100 | #331 | Tragic 8.1% |
| Pima | 0.0 /100 | #332 | Tragic 8.3% |
| Sioux | 0.0 /100 | #333 | Tragic 8.4% |
| Tsimshian | 0.0 /100 | #334 | Tragic 8.5% |
Demographics Similar to Immigrants from South Central Asia by Male Unemployment
In terms of male unemployment, the demographic groups most similar to Immigrants from South Central Asia are Tongan (4.8%, a difference of 0.030%), Carpatho Rusyn (4.8%, a difference of 0.070%), Immigrants from Taiwan (4.8%, a difference of 0.090%), Zimbabwean (4.8%, a difference of 0.10%), and Dutch (4.8%, a difference of 0.12%).
| Demographics | Rating | Rank | Male Unemployment |
| Filipinos | 99.9 /100 | #17 | Exceptional 4.7% |
| English | 99.9 /100 | #18 | Exceptional 4.8% |
| Europeans | 99.9 /100 | #19 | Exceptional 4.8% |
| Pennsylvania Germans | 99.9 /100 | #20 | Exceptional 4.8% |
| Immigrants | Taiwan | 99.9 /100 | #21 | Exceptional 4.8% |
| Carpatho Rusyns | 99.9 /100 | #22 | Exceptional 4.8% |
| Tongans | 99.9 /100 | #23 | Exceptional 4.8% |
| Immigrants | South Central Asia | 99.9 /100 | #24 | Exceptional 4.8% |
| Zimbabweans | 99.9 /100 | #25 | Exceptional 4.8% |
| Dutch | 99.9 /100 | #26 | Exceptional 4.8% |
| Belgians | 99.9 /100 | #27 | Exceptional 4.8% |
| Bulgarians | 99.8 /100 | #28 | Exceptional 4.8% |
| Scottish | 99.8 /100 | #29 | Exceptional 4.8% |
| British | 99.8 /100 | #30 | Exceptional 4.8% |
| Sudanese | 99.8 /100 | #31 | Exceptional 4.8% |