Australian vs Delaware Unemployment Among Women with Children Under 6 years
COMPARE
Australian
Delaware
Unemployment Among Women with Children Under 6 years
Unemployment Among Women with Children Under 6 years Comparison
Australians
Delaware
7.2%
UNEMPLOYMENT AMONG WOMEN WITH CHILDREN UNDER 6 YEARS
96.9/ 100
METRIC RATING
109th/ 347
METRIC RANK
9.8%
UNEMPLOYMENT AMONG WOMEN WITH CHILDREN UNDER 6 YEARS
0.0/ 100
METRIC RATING
326th/ 347
METRIC RANK
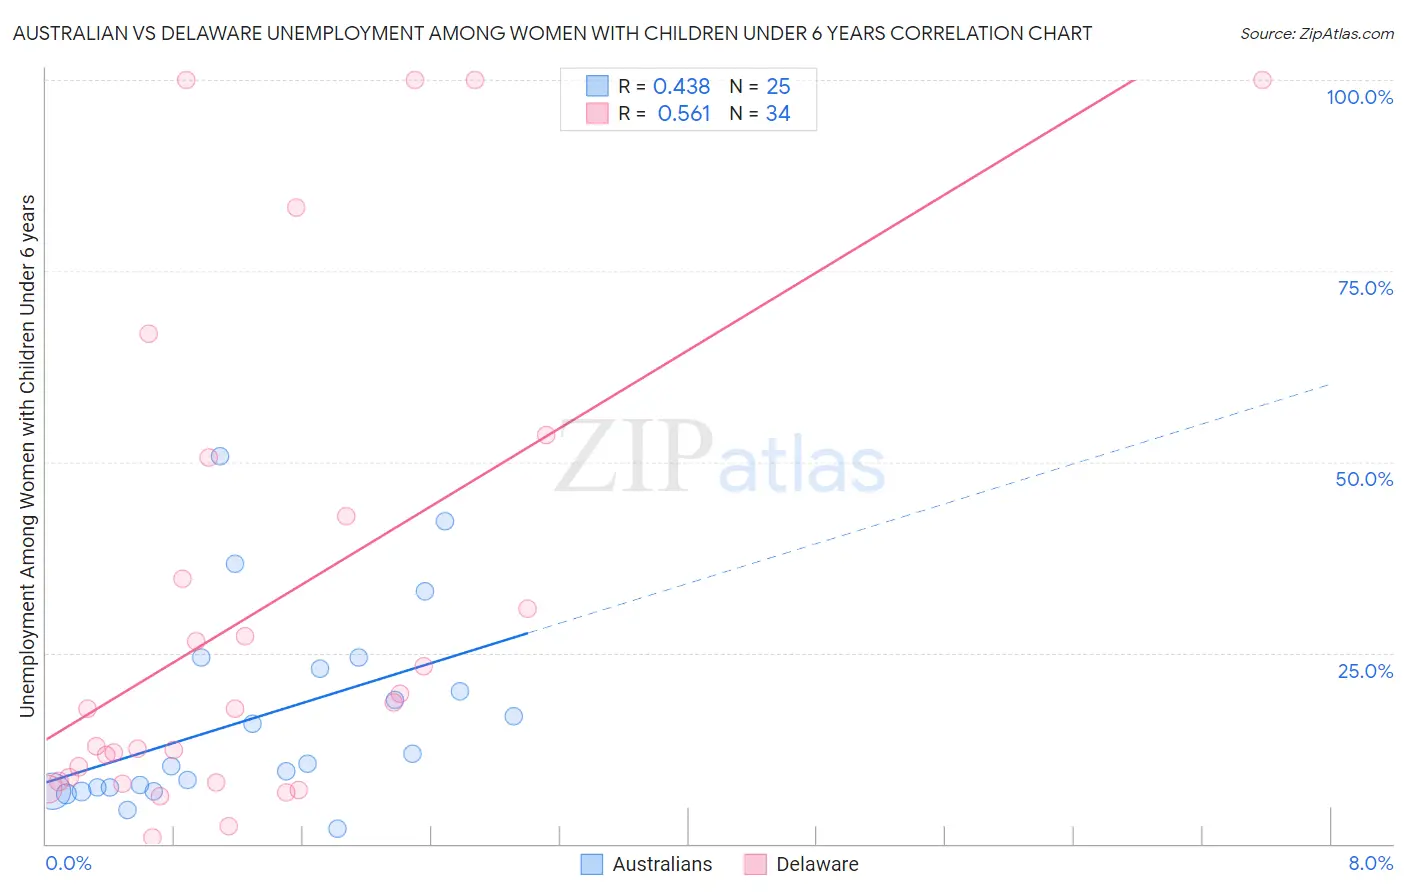
Australian vs Delaware Unemployment Among Women with Children Under 6 years Correlation Chart
The statistical analysis conducted on geographies consisting of 184,780,625 people shows a moderate positive correlation between the proportion of Australians and unemployment rate among women with children under the age of 6 in the United States with a correlation coefficient (R) of 0.438 and weighted average of 7.2%. Similarly, the statistical analysis conducted on geographies consisting of 85,487,463 people shows a substantial positive correlation between the proportion of Delaware and unemployment rate among women with children under the age of 6 in the United States with a correlation coefficient (R) of 0.561 and weighted average of 9.8%, a difference of 35.8%.
Unemployment Among Women with Children Under 6 years Correlation Summary
| Measurement | Australian | Delaware |
| Minimum | 1.9% | 0.90% |
| Maximum | 50.8% | 100.0% |
| Range | 48.9% | 99.1% |
| Mean | 16.5% | 30.8% |
| Median | 10.4% | 17.7% |
| Interquartile 25% (IQ1) | 7.2% | 8.2% |
| Interquartile 75% (IQ3) | 23.7% | 42.9% |
| Interquartile Range (IQR) | 16.5% | 34.7% |
| Standard Deviation (Sample) | 12.7% | 31.7% |
| Standard Deviation (Population) | 12.5% | 31.2% |
Similar Demographics by Unemployment Among Women with Children Under 6 years
Demographics Similar to Australians by Unemployment Among Women with Children Under 6 years
In terms of unemployment among women with children under 6 years, the demographic groups most similar to Australians are Eastern European (7.2%, a difference of 0.010%), Palestinian (7.2%, a difference of 0.070%), Immigrants from Kazakhstan (7.2%, a difference of 0.13%), Norwegian (7.2%, a difference of 0.13%), and Immigrants from Pakistan (7.2%, a difference of 0.14%).
| Demographics | Rating | Rank | Unemployment Among Women with Children Under 6 years |
| Immigrants | Nicaragua | 97.3 /100 | #102 | Exceptional 7.2% |
| Immigrants | Saudi Arabia | 97.3 /100 | #103 | Exceptional 7.2% |
| Immigrants | Egypt | 97.2 /100 | #104 | Exceptional 7.2% |
| Venezuelans | 97.2 /100 | #105 | Exceptional 7.2% |
| Immigrants | Pakistan | 97.2 /100 | #106 | Exceptional 7.2% |
| Immigrants | Kazakhstan | 97.1 /100 | #107 | Exceptional 7.2% |
| Eastern Europeans | 96.9 /100 | #108 | Exceptional 7.2% |
| Australians | 96.9 /100 | #109 | Exceptional 7.2% |
| Palestinians | 96.8 /100 | #110 | Exceptional 7.2% |
| Norwegians | 96.7 /100 | #111 | Exceptional 7.2% |
| Israelis | 96.5 /100 | #112 | Exceptional 7.2% |
| Nicaraguans | 96.3 /100 | #113 | Exceptional 7.2% |
| Argentineans | 96.2 /100 | #114 | Exceptional 7.2% |
| Immigrants | Italy | 96.1 /100 | #115 | Exceptional 7.2% |
| Armenians | 95.9 /100 | #116 | Exceptional 7.2% |
Demographics Similar to Delaware by Unemployment Among Women with Children Under 6 years
In terms of unemployment among women with children under 6 years, the demographic groups most similar to Delaware are Choctaw (9.8%, a difference of 0.030%), Ottawa (9.9%, a difference of 0.80%), Paiute (9.7%, a difference of 0.98%), Immigrants from Bahamas (9.6%, a difference of 1.7%), and Alaska Native (9.6%, a difference of 1.9%).
| Demographics | Rating | Rank | Unemployment Among Women with Children Under 6 years |
| Marshallese | 0.0 /100 | #319 | Tragic 9.6% |
| Potawatomi | 0.0 /100 | #320 | Tragic 9.6% |
| Central American Indians | 0.0 /100 | #321 | Tragic 9.6% |
| Alaska Natives | 0.0 /100 | #322 | Tragic 9.6% |
| Immigrants | Bahamas | 0.0 /100 | #323 | Tragic 9.6% |
| Paiute | 0.0 /100 | #324 | Tragic 9.7% |
| Choctaw | 0.0 /100 | #325 | Tragic 9.8% |
| Delaware | 0.0 /100 | #326 | Tragic 9.8% |
| Ottawa | 0.0 /100 | #327 | Tragic 9.9% |
| Tohono O'odham | 0.0 /100 | #328 | Tragic 10.2% |
| Blacks/African Americans | 0.0 /100 | #329 | Tragic 10.3% |
| Pennsylvania Germans | 0.0 /100 | #330 | Tragic 10.8% |
| Colville | 0.0 /100 | #331 | Tragic 11.2% |
| Sioux | 0.0 /100 | #332 | Tragic 11.5% |
| Natives/Alaskans | 0.0 /100 | #333 | Tragic 11.5% |