Paiute vs Immigrants from Norway Unemployment Among Women with Children Under 6 years
COMPARE
Paiute
Immigrants from Norway
Unemployment Among Women with Children Under 6 years
Unemployment Among Women with Children Under 6 years Comparison
Paiute
Immigrants from Norway
9.7%
UNEMPLOYMENT AMONG WOMEN WITH CHILDREN UNDER 6 YEARS
0.0/ 100
METRIC RATING
324th/ 347
METRIC RANK
7.4%
UNEMPLOYMENT AMONG WOMEN WITH CHILDREN UNDER 6 YEARS
84.1/ 100
METRIC RATING
138th/ 347
METRIC RANK
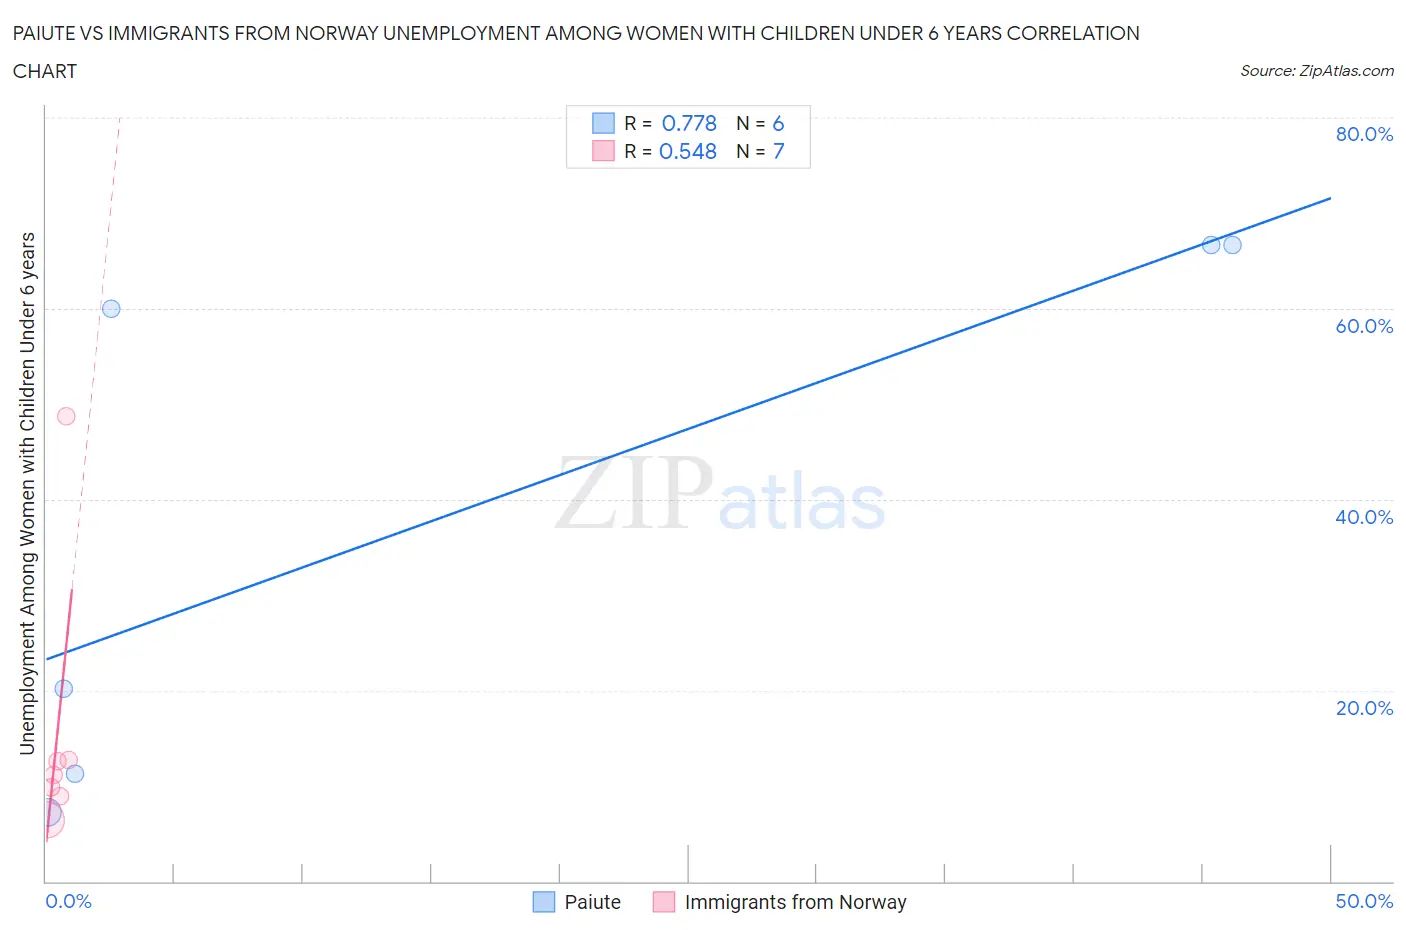
Paiute vs Immigrants from Norway Unemployment Among Women with Children Under 6 years Correlation Chart
The statistical analysis conducted on geographies consisting of 54,107,424 people shows a strong positive correlation between the proportion of Paiute and unemployment rate among women with children under the age of 6 in the United States with a correlation coefficient (R) of 0.778 and weighted average of 9.7%. Similarly, the statistical analysis conducted on geographies consisting of 101,007,558 people shows a substantial positive correlation between the proportion of Immigrants from Norway and unemployment rate among women with children under the age of 6 in the United States with a correlation coefficient (R) of 0.548 and weighted average of 7.4%, a difference of 30.4%.
Unemployment Among Women with Children Under 6 years Correlation Summary
| Measurement | Paiute | Immigrants from Norway |
| Minimum | 7.2% | 6.4% |
| Maximum | 66.7% | 48.6% |
| Range | 59.5% | 42.2% |
| Mean | 38.7% | 15.7% |
| Median | 40.1% | 11.1% |
| Interquartile 25% (IQ1) | 11.3% | 8.9% |
| Interquartile 75% (IQ3) | 66.7% | 12.7% |
| Interquartile Range (IQR) | 55.4% | 3.8% |
| Standard Deviation (Sample) | 28.7% | 14.7% |
| Standard Deviation (Population) | 26.2% | 13.6% |
Similar Demographics by Unemployment Among Women with Children Under 6 years
Demographics Similar to Paiute by Unemployment Among Women with Children Under 6 years
In terms of unemployment among women with children under 6 years, the demographic groups most similar to Paiute are Immigrants from Bahamas (9.6%, a difference of 0.70%), Alaska Native (9.6%, a difference of 0.89%), Choctaw (9.8%, a difference of 0.95%), Delaware (9.8%, a difference of 0.98%), and Central American Indian (9.6%, a difference of 1.1%).
| Demographics | Rating | Rank | Unemployment Among Women with Children Under 6 years |
| Dutch West Indians | 0.0 /100 | #317 | Tragic 9.5% |
| Osage | 0.0 /100 | #318 | Tragic 9.5% |
| Marshallese | 0.0 /100 | #319 | Tragic 9.6% |
| Potawatomi | 0.0 /100 | #320 | Tragic 9.6% |
| Central American Indians | 0.0 /100 | #321 | Tragic 9.6% |
| Alaska Natives | 0.0 /100 | #322 | Tragic 9.6% |
| Immigrants | Bahamas | 0.0 /100 | #323 | Tragic 9.6% |
| Paiute | 0.0 /100 | #324 | Tragic 9.7% |
| Choctaw | 0.0 /100 | #325 | Tragic 9.8% |
| Delaware | 0.0 /100 | #326 | Tragic 9.8% |
| Ottawa | 0.0 /100 | #327 | Tragic 9.9% |
| Tohono O'odham | 0.0 /100 | #328 | Tragic 10.2% |
| Blacks/African Americans | 0.0 /100 | #329 | Tragic 10.3% |
| Pennsylvania Germans | 0.0 /100 | #330 | Tragic 10.8% |
| Colville | 0.0 /100 | #331 | Tragic 11.2% |
Demographics Similar to Immigrants from Norway by Unemployment Among Women with Children Under 6 years
In terms of unemployment among women with children under 6 years, the demographic groups most similar to Immigrants from Norway are Immigrants from Colombia (7.4%, a difference of 0.020%), Immigrants from Cambodia (7.4%, a difference of 0.070%), Immigrants from Morocco (7.4%, a difference of 0.11%), Scandinavian (7.4%, a difference of 0.13%), and Immigrants from Northern Africa (7.4%, a difference of 0.17%).
| Demographics | Rating | Rank | Unemployment Among Women with Children Under 6 years |
| Ukrainians | 88.2 /100 | #131 | Excellent 7.4% |
| Immigrants | Armenia | 87.4 /100 | #132 | Excellent 7.4% |
| Immigrants | Uganda | 86.5 /100 | #133 | Excellent 7.4% |
| Immigrants | Bolivia | 85.7 /100 | #134 | Excellent 7.4% |
| Immigrants | Northern Africa | 85.3 /100 | #135 | Excellent 7.4% |
| Immigrants | Morocco | 84.9 /100 | #136 | Excellent 7.4% |
| Immigrants | Cambodia | 84.6 /100 | #137 | Excellent 7.4% |
| Immigrants | Norway | 84.1 /100 | #138 | Excellent 7.4% |
| Immigrants | Colombia | 83.9 /100 | #139 | Excellent 7.4% |
| Scandinavians | 83.0 /100 | #140 | Excellent 7.4% |
| Greeks | 82.6 /100 | #141 | Excellent 7.4% |
| Immigrants | Argentina | 81.5 /100 | #142 | Excellent 7.5% |
| Koreans | 81.3 /100 | #143 | Excellent 7.5% |
| Europeans | 79.1 /100 | #144 | Good 7.5% |
| Immigrants | Jordan | 78.9 /100 | #145 | Good 7.5% |