Burmese vs Immigrants from Uzbekistan Female Unemployment

COMPARE

Burmese
Race
Ancestry
AfghanAfricanAlaska NativeAlaskan AthabascanAlbanianAleutAlsatianAmericanApacheArabArapahoArgentineanArmenianAssyrian/Chaldean/SyriacAustralianAustrianBahamianBangladeshiBarbadianBasqueBelgianBelizeanBermudanBhutaneseBlackfeetBolivianBrazilianBritishBritish West IndianBulgarianBurmeseCajunCambodianCanadianCape VerdeanCarpatho RusynCelticCentral AmericanCentral American IndianCherokeeCheyenneChickasawChileanChineseChippewaChoctawColombianColvilleComancheCosta RicanCreeCreekCroatianCrowCubanCypriotCzechCzechoslovakianDanishDelawareDominicanDutchDutch West IndianEastern EuropeanEcuadorianEgyptianEnglishEstonianEthiopianEuropeanFijianFilipinoFinnishFrenchFrench American IndianFrench CanadianGermanGerman RussianGhanaianGreekGuamanian/ChamorroGuatemalanGuyaneseHaitianHmongHonduranHopiHoumaHungarianIcelanderIndian (Asian)IndonesianInupiatIranianIraqiIrishIroquoisIsraeliItalianJamaicanJapaneseJordanianKenyanKiowaKoreanLaotianLatvianLebaneseLiberianLithuanianLumbeeLuxembourgerMacedonianMalaysianMalteseMarshalleseMenomineeMexicanMexican American IndianMongolianMoroccanNative HawaiianNavajoNepaleseNew ZealanderNicaraguanNigerianNorthern EuropeanNorwegianOkinawanOsageOttawaPaiutePakistaniPalestinianPanamanianParaguayanPennsylvania GermanPeruvianPimaPolishPortuguesePotawatomiPuebloPuerto RicanPuget Sound SalishRomanianRussianSalvadoranSamoanScandinavianScotch-IrishScottishSeminoleSenegaleseSerbianShoshoneSierra LeoneanSiouxSlavicSlovakSloveneSomaliSouth AfricanSouth AmericanSouth American IndianSoviet UnionSpaniardSpanishSpanish AmericanSpanish American IndianSri LankanSubsaharan AfricanSudaneseSwedishSwissSyrianTaiwaneseThaiTlingit-HaidaTohono O'OdhamTonganTrinidadian and TobagonianTsimshianTurkishU.S. Virgin IslanderUgandanUkrainianUruguayanUteVenezuelanVietnameseWelshWest IndianYakamaYaquiYugoslavianYumanYup'ikZimbabwean
Immigration
NonimmigrantsImmigrantsAfghanistanAfricaAlbaniaArgentinaArmeniaAsiaAustraliaAustriaBahamasBangladeshBarbadosBelarusBelgiumBelizeBoliviaBosnia and HerzegovinaBrazilBulgariaBurma/MyanmarCabo VerdeCambodiaCameroonCanadaCaribbeanCentral AmericaChileChinaColombiaCongoCosta RicaCroatiaCubaCzechoslovakiaDenmarkDominicaDominican RepublicEastern AfricaEastern AsiaEastern EuropeEcuadorEgyptEl SalvadorEnglandEritreaEthiopiaEuropeFijiFranceGermanyGhanaGreeceGrenadaGuatemalaGuyanaHaitiHondurasHong KongHungaryIndiaIndonesiaIranIraqIrelandIsraelItalyJamaicaJapanJordanKazakhstanKenyaKoreaKuwaitLaosLatin AmericaLatviaLebanonLiberiaLithuaniaMalaysiaMexicoMicronesiaMiddle AfricaMoldovaMoroccoNepalNetherlandsNicaraguaNigeriaNorth AmericaNorth MacedoniaNorthern AfricaNorthern EuropeNorwayOceaniaPakistanPanamaPeruPhilippinesPolandPortugalRomaniaRussiaSaudi ArabiaScotlandSenegalSerbiaSierra LeoneSingaporeSomaliaSouth AfricaSouth AmericaSouth Central AsiaSouth Eastern AsiaSouthern EuropeSpainSri LankaSt. Vincent and the GrenadinesSudanSwedenSwitzerlandSyriaTaiwanThailandTrinidad and TobagoTurkeyUgandaUkraineUruguayVenezuelaVietnamWest IndiesWestern AfricaWestern AsiaWestern EuropeYemenZaireZimbabweAzores
Immigrants from Uzbekistan
Race
Ancestry
AfghanAfricanAlaska NativeAlaskan AthabascanAlbanianAleutAlsatianAmericanApacheArabArapahoArgentineanArmenianAssyrian/Chaldean/SyriacAustralianAustrianBahamianBangladeshiBarbadianBasqueBelgianBelizeanBermudanBhutaneseBlackfeetBolivianBrazilianBritishBritish West IndianBulgarianCajunCambodianCanadianCape VerdeanCarpatho RusynCelticCentral AmericanCentral American IndianCherokeeCheyenneChickasawChileanChineseChippewaChoctawColombianColvilleComancheCosta RicanCreeCreekCroatianCrowCubanCypriotCzechCzechoslovakianDanishDelawareDominicanDutchDutch West IndianEastern EuropeanEcuadorianEgyptianEnglishEstonianEthiopianEuropeanFijianFilipinoFinnishFrenchFrench American IndianFrench CanadianGermanGerman RussianGhanaianGreekGuamanian/ChamorroGuatemalanGuyaneseHaitianHmongHonduranHopiHoumaHungarianIcelanderIndian (Asian)IndonesianInupiatIranianIraqiIrishIroquoisIsraeliItalianJamaicanJapaneseJordanianKenyanKiowaKoreanLaotianLatvianLebaneseLiberianLithuanianLumbeeLuxembourgerMacedonianMalaysianMalteseMarshalleseMenomineeMexicanMexican American IndianMongolianMoroccanNative HawaiianNavajoNepaleseNew ZealanderNicaraguanNigerianNorthern EuropeanNorwegianOkinawanOsageOttawaPaiutePakistaniPalestinianPanamanianParaguayanPennsylvania GermanPeruvianPimaPolishPortuguesePotawatomiPuebloPuerto RicanPuget Sound SalishRomanianRussianSalvadoranSamoanScandinavianScotch-IrishScottishSeminoleSenegaleseSerbianShoshoneSierra LeoneanSiouxSlavicSlovakSloveneSomaliSouth AfricanSouth AmericanSouth American IndianSoviet UnionSpaniardSpanishSpanish AmericanSpanish American IndianSri LankanSubsaharan AfricanSudaneseSwedishSwissSyrianTaiwaneseThaiTlingit-HaidaTohono O'OdhamTonganTrinidadian and TobagonianTsimshianTurkishU.S. Virgin IslanderUgandanUkrainianUruguayanUteVenezuelanVietnameseWelshWest IndianYakamaYaquiYugoslavianYumanYup'ikZimbabwean
Immigration
NonimmigrantsImmigrantsAfghanistanAfricaAlbaniaArgentinaArmeniaAsiaAustraliaAustriaBahamasBangladeshBarbadosBelarusBelgiumBelizeBoliviaBosnia and HerzegovinaBrazilBulgariaBurma/MyanmarCabo VerdeCambodiaCameroonCanadaCaribbeanCentral AmericaChileChinaColombiaCongoCosta RicaCroatiaCubaCzechoslovakiaDenmarkDominicaDominican RepublicEastern AfricaEastern AsiaEastern EuropeEcuadorEgyptEl SalvadorEnglandEritreaEthiopiaEuropeFijiFranceGermanyGhanaGreeceGrenadaGuatemalaGuyanaHaitiHondurasHong KongHungaryIndiaIndonesiaIranIraqIrelandIsraelItalyJamaicaJapanJordanKazakhstanKenyaKoreaKuwaitLaosLatin AmericaLatviaLebanonLiberiaLithuaniaMalaysiaMexicoMicronesiaMiddle AfricaMoldovaMoroccoNepalNetherlandsNicaraguaNigeriaNorth AmericaNorth MacedoniaNorthern AfricaNorthern EuropeNorwayOceaniaPakistanPanamaPeruPhilippinesPolandPortugalRomaniaRussiaSaudi ArabiaScotlandSenegalSerbiaSierra LeoneSingaporeSomaliaSouth AfricaSouth AmericaSouth Central AsiaSouth Eastern AsiaSouthern EuropeSpainSri LankaSt. Vincent and the GrenadinesSudanSwedenSwitzerlandSyriaTaiwanThailandTrinidad and TobagoTurkeyUgandaUkraineUruguayUzbekistanVenezuelaVietnamWest IndiesWestern AfricaWestern AsiaWestern EuropeYemenZaireZimbabweAzores
Female Unemployment
Income
Poverty
Unemployment
Labor Participation
Family Structure
Vehicle Availability
Education Level
Disability

Female Unemployment Comparison

Burmese

Immigrants from Uzbekistan

Exceptional
Tragic
5.0%
FEMALE UNEMPLOYMENT
95.6/ 100
METRIC RATING
95th/ 347
METRIC RANK
5.6%
FEMALE UNEMPLOYMENT
1.0/ 100
METRIC RATING
249th/ 347
METRIC RANK

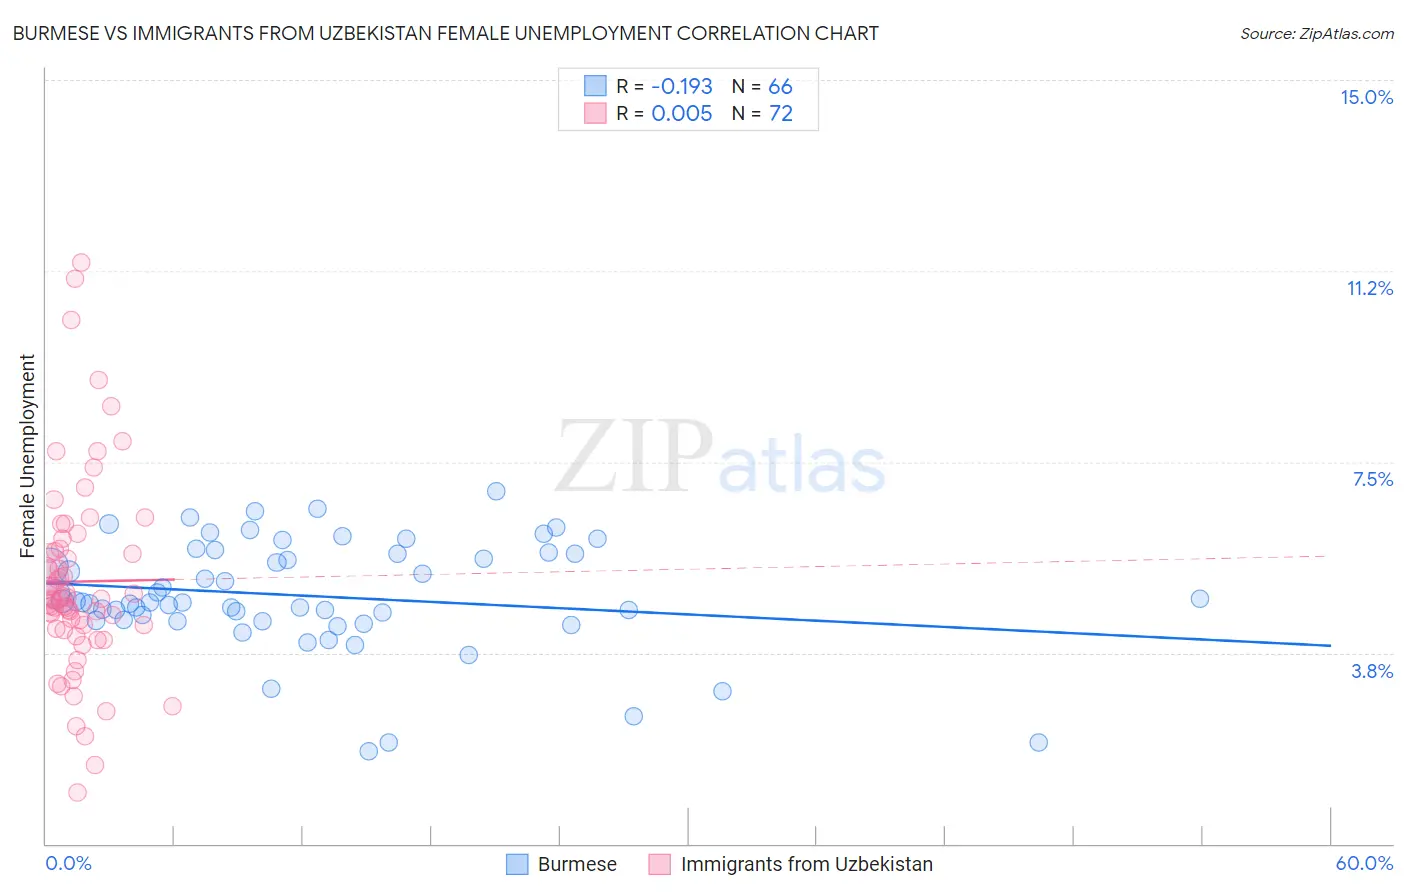
Burmese vs Immigrants from Uzbekistan Female Unemployment Correlation Chart

The statistical analysis conducted on geographies consisting of 462,170,417 people shows a poor negative correlation between the proportion of Burmese and unemploymnet rate among females in the United States with a correlation coefficient (R) of -0.193 and weighted average of 5.0%. Similarly, the statistical analysis conducted on geographies consisting of 118,629,225 people shows no correlation between the proportion of Immigrants from Uzbekistan and unemploymnet rate among females in the United States with a correlation coefficient (R) of 0.005 and weighted average of 5.6%, a difference of 12.1%.
Burmese vs Immigrants from Uzbekistan Female Unemployment

Female Unemployment Correlation Summary

MeasurementBurmeseImmigrants from Uzbekistan
Minimum1.8%1.0%
Maximum6.9%11.4%
Range5.1%10.4%
Mean4.9%5.1%
Median4.7%4.8%
Interquartile 25% (IQ1)4.4%4.3%
Interquartile 75% (IQ3)5.7%5.8%
Interquartile Range (IQR)1.3%1.5%
Standard Deviation (Sample)1.1%1.9%
Standard Deviation (Population)1.1%1.9%

Similar Demographics by Female Unemployment

Demographics Similar to Burmese by Female Unemployment

In terms of female unemployment, the demographic groups most similar to Burmese are Immigrants from Malaysia (5.0%, a difference of 0.020%), Immigrants from Austria (5.0%, a difference of 0.040%), Immigrants from South Central Asia (5.0%, a difference of 0.040%), Romanian (5.0%, a difference of 0.12%), and Immigrants from Japan (5.0%, a difference of 0.15%).
DemographicsRating | RankFemale Unemployment
Immigrants | Sudan
96.7
/100
|
#88
Exceptional
5.0%
Immigrants | Taiwan
96.6
/100
|
#89
Exceptional
5.0%
Immigrants | Sweden
96.3
/100
|
#90
Exceptional
5.0%
Immigrants | Japan
96.0
/100
|
#91
Exceptional
5.0%
Romanians
95.9
/100
|
#92
Exceptional
5.0%
Immigrants | Austria
95.7
/100
|
#93
Exceptional
5.0%
Immigrants | Malaysia
95.7
/100
|
#94
Exceptional
5.0%
Burmese
95.6
/100
|
#95
Exceptional
5.0%
Immigrants | South Central Asia
95.5
/100
|
#96
Exceptional
5.0%
Immigrants | Somalia
95.2
/100
|
#97
Exceptional
5.0%
Immigrants | Kuwait
95.2
/100
|
#98
Exceptional
5.0%
Immigrants | Zaire
95.2
/100
|
#99
Exceptional
5.0%
Indonesians
95.1
/100
|
#100
Exceptional
5.0%
Immigrants | Czechoslovakia
95.0
/100
|
#101
Exceptional
5.0%
Immigrants | Kenya
94.8
/100
|
#102
Exceptional
5.0%

Demographics Similar to Immigrants from Uzbekistan by Female Unemployment

In terms of female unemployment, the demographic groups most similar to Immigrants from Uzbekistan are Cree (5.6%, a difference of 0.040%), Immigrants from Western Asia (5.6%, a difference of 0.20%), Japanese (5.6%, a difference of 0.28%), Immigrants from Syria (5.6%, a difference of 0.29%), and Assyrian/Chaldean/Syriac (5.6%, a difference of 0.35%).
DemographicsRating | RankFemale Unemployment
Marshallese
2.3
/100
|
#242
Tragic
5.6%
Spanish Americans
2.2
/100
|
#243
Tragic
5.6%
Immigrants | Liberia
1.5
/100
|
#244
Tragic
5.6%
Guamanians/Chamorros
1.4
/100
|
#245
Tragic
5.6%
Japanese
1.2
/100
|
#246
Tragic
5.6%
Immigrants | Western Asia
1.1
/100
|
#247
Tragic
5.6%
Cree
1.0
/100
|
#248
Tragic
5.6%
Immigrants | Uzbekistan
1.0
/100
|
#249
Tragic
5.6%
Immigrants | Syria
0.8
/100
|
#250
Tragic
5.6%
Assyrians/Chaldeans/Syriacs
0.8
/100
|
#251
Tragic
5.6%
Cajuns
0.7
/100
|
#252
Tragic
5.7%
Immigrants | Sierra Leone
0.6
/100
|
#253
Tragic
5.7%
Immigrants | Immigrants
0.6
/100
|
#254
Tragic
5.7%
Immigrants | Cameroon
0.6
/100
|
#255
Tragic
5.7%
Sub-Saharan Africans
0.4
/100
|
#256
Tragic
5.7%