Syrian vs Immigrants from Northern Africa Female Unemployment
COMPARE
Syrian
Immigrants from Northern Africa
Female Unemployment
Female Unemployment Comparison
Syrians
Immigrants from Northern Africa
5.2%
FEMALE UNEMPLOYMENT
62.8/ 100
METRIC RATING
165th/ 347
METRIC RANK
5.2%
FEMALE UNEMPLOYMENT
69.6/ 100
METRIC RATING
156th/ 347
METRIC RANK
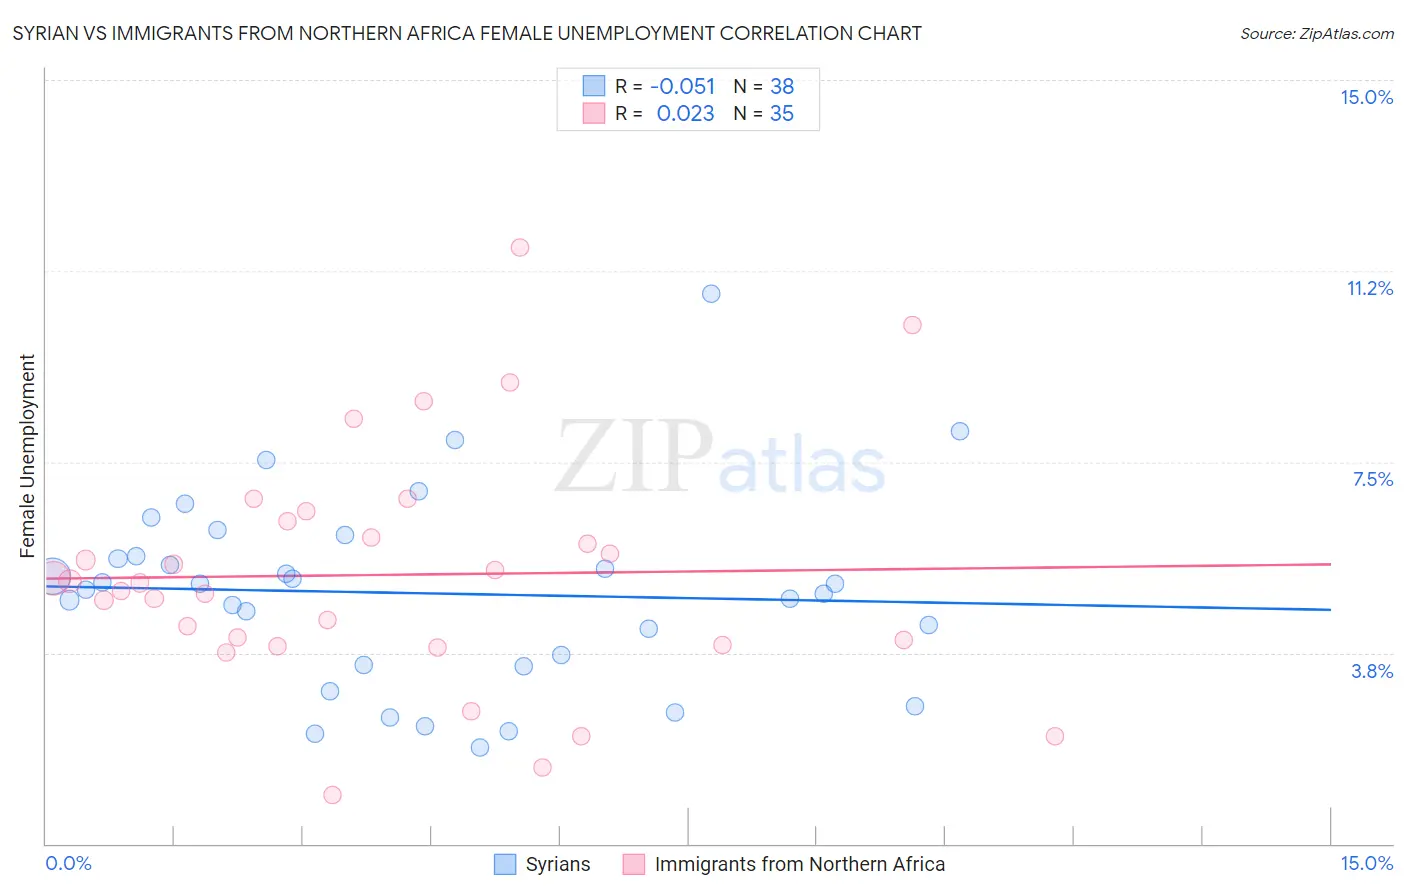
Syrian vs Immigrants from Northern Africa Female Unemployment Correlation Chart
The statistical analysis conducted on geographies consisting of 265,589,299 people shows a slight negative correlation between the proportion of Syrians and unemploymnet rate among females in the United States with a correlation coefficient (R) of -0.051 and weighted average of 5.2%. Similarly, the statistical analysis conducted on geographies consisting of 320,534,342 people shows no correlation between the proportion of Immigrants from Northern Africa and unemploymnet rate among females in the United States with a correlation coefficient (R) of 0.023 and weighted average of 5.2%, a difference of 0.47%.
Female Unemployment Correlation Summary
| Measurement | Syrian | Immigrants from Northern Africa |
| Minimum | 1.9% | 0.96% |
| Maximum | 10.8% | 11.7% |
| Range | 8.9% | 10.7% |
| Mean | 4.9% | 5.3% |
| Median | 5.0% | 5.1% |
| Interquartile 25% (IQ1) | 3.5% | 3.9% |
| Interquartile 75% (IQ3) | 5.6% | 6.3% |
| Interquartile Range (IQR) | 2.1% | 2.4% |
| Standard Deviation (Sample) | 1.9% | 2.3% |
| Standard Deviation (Population) | 1.9% | 2.3% |
Demographics Similar to Syrians and Immigrants from Northern Africa by Female Unemployment
In terms of female unemployment, the demographic groups most similar to Syrians are Native Hawaiian (5.2%, a difference of 0.0%), Immigrants from Thailand (5.2%, a difference of 0.040%), Immigrants from Asia (5.2%, a difference of 0.10%), Bangladeshi (5.2%, a difference of 0.10%), and Potawatomi (5.2%, a difference of 0.21%). Similarly, the demographic groups most similar to Immigrants from Northern Africa are Immigrants from Russia (5.2%, a difference of 0.020%), Immigrants from Egypt (5.2%, a difference of 0.030%), South African (5.2%, a difference of 0.080%), Albanian (5.2%, a difference of 0.10%), and Immigrants from Micronesia (5.2%, a difference of 0.19%).
| Demographics | Rating | Rank | Female Unemployment |
| Egyptians | 78.3 /100 | #150 | Good 5.2% |
| Immigrants | China | 75.9 /100 | #151 | Good 5.2% |
| Immigrants | Italy | 75.0 /100 | #152 | Good 5.2% |
| Immigrants | Greece | 74.9 /100 | #153 | Good 5.2% |
| South Africans | 70.8 /100 | #154 | Good 5.2% |
| Immigrants | Egypt | 70.0 /100 | #155 | Good 5.2% |
| Immigrants | Northern Africa | 69.6 /100 | #156 | Good 5.2% |
| Immigrants | Russia | 69.3 /100 | #157 | Good 5.2% |
| Albanians | 68.3 /100 | #158 | Good 5.2% |
| Immigrants | Micronesia | 66.9 /100 | #159 | Good 5.2% |
| Immigrants | Spain | 66.8 /100 | #160 | Good 5.2% |
| Immigrants | Pakistan | 66.7 /100 | #161 | Good 5.2% |
| Potawatomi | 65.9 /100 | #162 | Good 5.2% |
| Immigrants | Asia | 64.3 /100 | #163 | Good 5.2% |
| Bangladeshis | 64.3 /100 | #164 | Good 5.2% |
| Syrians | 62.8 /100 | #165 | Good 5.2% |
| Native Hawaiians | 62.7 /100 | #166 | Good 5.2% |
| Immigrants | Thailand | 62.1 /100 | #167 | Good 5.2% |
| Sri Lankans | 59.4 /100 | #168 | Average 5.2% |
| Immigrants | Chile | 59.0 /100 | #169 | Average 5.2% |
| Spanish | 55.9 /100 | #170 | Average 5.2% |