Ottawa vs Black/African American Unemployment Among Ages 35 to 44 years
COMPARE
Ottawa
Black/African American
Unemployment Among Ages 35 to 44 years
Unemployment Among Ages 35 to 44 years Comparison
Ottawa
Blacks/African Americans
5.6%
UNEMPLOYMENT AMONG AGES 35 TO 44 YEARS
0.0/ 100
METRIC RATING
295th/ 347
METRIC RANK
6.1%
UNEMPLOYMENT AMONG AGES 35 TO 44 YEARS
0.0/ 100
METRIC RATING
315th/ 347
METRIC RANK
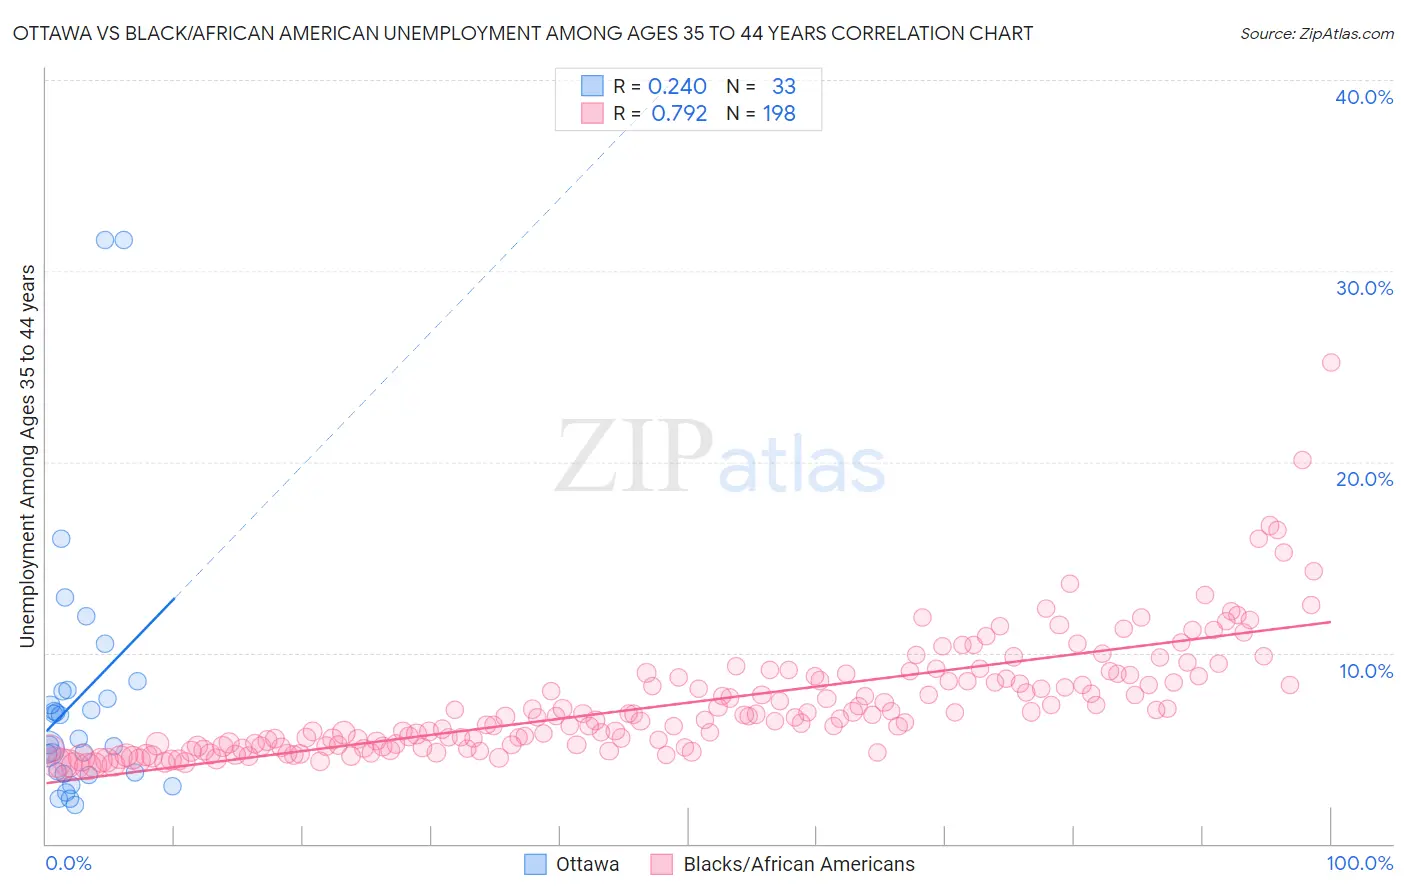
Ottawa vs Black/African American Unemployment Among Ages 35 to 44 years Correlation Chart
The statistical analysis conducted on geographies consisting of 49,559,815 people shows a weak positive correlation between the proportion of Ottawa and unemployment rate among population between the ages 35 and 44 in the United States with a correlation coefficient (R) of 0.240 and weighted average of 5.6%. Similarly, the statistical analysis conducted on geographies consisting of 531,599,324 people shows a strong positive correlation between the proportion of Blacks/African Americans and unemployment rate among population between the ages 35 and 44 in the United States with a correlation coefficient (R) of 0.792 and weighted average of 6.1%, a difference of 9.6%.
Unemployment Among Ages 35 to 44 years Correlation Summary
| Measurement | Ottawa | Black/African American |
| Minimum | 2.0% | 4.1% |
| Maximum | 31.6% | 25.2% |
| Range | 29.6% | 21.1% |
| Mean | 7.7% | 7.4% |
| Median | 5.5% | 6.6% |
| Interquartile 25% (IQ1) | 3.7% | 5.1% |
| Interquartile 75% (IQ3) | 8.0% | 8.7% |
| Interquartile Range (IQR) | 4.3% | 3.6% |
| Standard Deviation (Sample) | 6.9% | 3.1% |
| Standard Deviation (Population) | 6.8% | 3.0% |
Demographics Similar to Ottawa and Blacks/African Americans by Unemployment Among Ages 35 to 44 years
In terms of unemployment among ages 35 to 44 years, the demographic groups most similar to Ottawa are Immigrants from Trinidad and Tobago (5.6%, a difference of 0.020%), U.S. Virgin Islander (5.6%, a difference of 0.12%), Aleut (5.6%, a difference of 0.13%), Immigrants from Jamaica (5.6%, a difference of 0.23%), and Immigrants from West Indies (5.6%, a difference of 0.29%). Similarly, the demographic groups most similar to Blacks/African Americans are Immigrants from Dominica (6.0%, a difference of 1.8%), British West Indian (6.0%, a difference of 2.2%), Immigrants from Guyana (6.0%, a difference of 2.3%), Marshallese (5.9%, a difference of 3.4%), and Guyanese (5.9%, a difference of 3.7%).
| Demographics | Rating | Rank | Unemployment Among Ages 35 to 44 years |
| Ottawa | 0.0 /100 | #295 | Tragic 5.6% |
| Immigrants | Trinidad and Tobago | 0.0 /100 | #296 | Tragic 5.6% |
| U.S. Virgin Islanders | 0.0 /100 | #297 | Tragic 5.6% |
| Aleuts | 0.0 /100 | #298 | Tragic 5.6% |
| Immigrants | Jamaica | 0.0 /100 | #299 | Tragic 5.6% |
| Immigrants | West Indies | 0.0 /100 | #300 | Tragic 5.6% |
| Africans | 0.0 /100 | #301 | Tragic 5.6% |
| Nepalese | 0.0 /100 | #302 | Tragic 5.6% |
| Yakama | 0.0 /100 | #303 | Tragic 5.6% |
| West Indians | 0.0 /100 | #304 | Tragic 5.7% |
| Belizeans | 0.0 /100 | #305 | Tragic 5.7% |
| Barbadians | 0.0 /100 | #306 | Tragic 5.7% |
| Immigrants | Belize | 0.0 /100 | #307 | Tragic 5.8% |
| Immigrants | Azores | 0.0 /100 | #308 | Tragic 5.8% |
| Immigrants | Barbados | 0.0 /100 | #309 | Tragic 5.8% |
| Guyanese | 0.0 /100 | #310 | Tragic 5.9% |
| Marshallese | 0.0 /100 | #311 | Tragic 5.9% |
| Immigrants | Guyana | 0.0 /100 | #312 | Tragic 6.0% |
| British West Indians | 0.0 /100 | #313 | Tragic 6.0% |
| Immigrants | Dominica | 0.0 /100 | #314 | Tragic 6.0% |
| Blacks/African Americans | 0.0 /100 | #315 | Tragic 6.1% |