Okinawan vs Paiute Unemployment
COMPARE
Okinawan
Paiute
Unemployment
Unemployment Comparison
Okinawans
Paiute
4.9%
UNEMPLOYMENT
97.9/ 100
METRIC RATING
78th/ 347
METRIC RANK
7.1%
UNEMPLOYMENT
0.0/ 100
METRIC RATING
326th/ 347
METRIC RANK
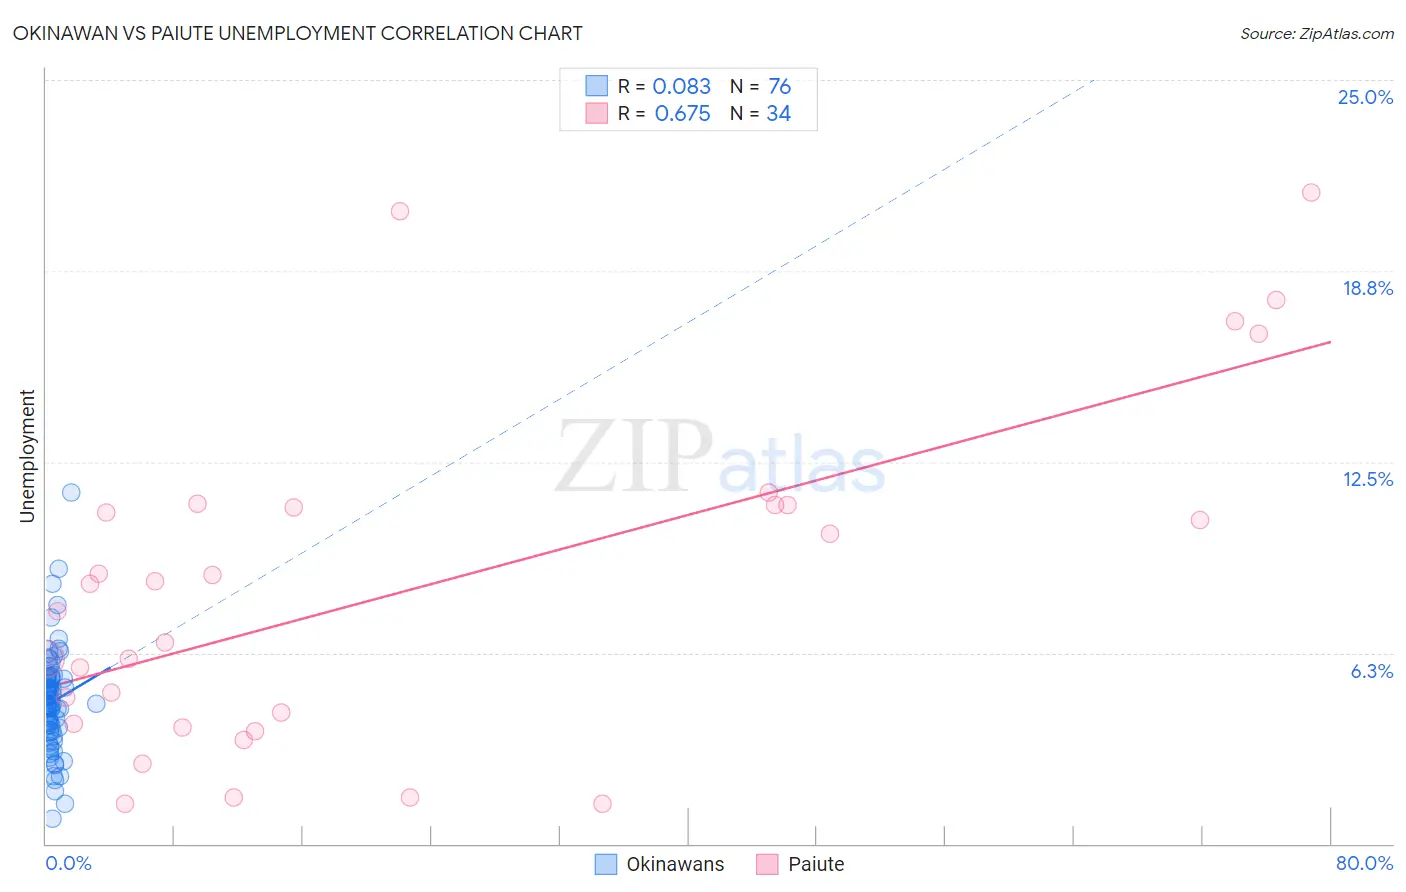
Okinawan vs Paiute Unemployment Correlation Chart
The statistical analysis conducted on geographies consisting of 73,771,070 people shows a slight positive correlation between the proportion of Okinawans and unemployment in the United States with a correlation coefficient (R) of 0.083 and weighted average of 4.9%. Similarly, the statistical analysis conducted on geographies consisting of 58,375,117 people shows a significant positive correlation between the proportion of Paiute and unemployment in the United States with a correlation coefficient (R) of 0.675 and weighted average of 7.1%, a difference of 43.8%.
Unemployment Correlation Summary
| Measurement | Okinawan | Paiute |
| Minimum | 0.80% | 1.3% |
| Maximum | 11.5% | 21.3% |
| Range | 10.7% | 20.0% |
| Mean | 4.6% | 8.4% |
| Median | 4.6% | 8.1% |
| Interquartile 25% (IQ1) | 3.7% | 3.9% |
| Interquartile 75% (IQ3) | 5.5% | 11.1% |
| Interquartile Range (IQR) | 1.8% | 7.2% |
| Standard Deviation (Sample) | 1.7% | 5.5% |
| Standard Deviation (Population) | 1.7% | 5.4% |
Similar Demographics by Unemployment
Demographics Similar to Okinawans by Unemployment
In terms of unemployment, the demographic groups most similar to Okinawans are Cypriot (4.9%, a difference of 0.040%), German Russian (4.9%, a difference of 0.10%), Canadian (5.0%, a difference of 0.12%), Turkish (4.9%, a difference of 0.13%), and Immigrants from Sweden (5.0%, a difference of 0.19%).
| Demographics | Rating | Rank | Unemployment |
| Immigrants | Japan | 98.3 /100 | #71 | Exceptional 4.9% |
| Burmese | 98.3 /100 | #72 | Exceptional 4.9% |
| Paraguayans | 98.3 /100 | #73 | Exceptional 4.9% |
| Immigrants | Northern Europe | 98.2 /100 | #74 | Exceptional 4.9% |
| Turks | 98.0 /100 | #75 | Exceptional 4.9% |
| German Russians | 98.0 /100 | #76 | Exceptional 4.9% |
| Cypriots | 97.9 /100 | #77 | Exceptional 4.9% |
| Okinawans | 97.9 /100 | #78 | Exceptional 4.9% |
| Canadians | 97.7 /100 | #79 | Exceptional 5.0% |
| Immigrants | Sweden | 97.6 /100 | #80 | Exceptional 5.0% |
| Basques | 97.6 /100 | #81 | Exceptional 5.0% |
| Fijians | 97.6 /100 | #82 | Exceptional 5.0% |
| Hmong | 97.6 /100 | #83 | Exceptional 5.0% |
| Russians | 97.4 /100 | #84 | Exceptional 5.0% |
| Immigrants | Australia | 97.0 /100 | #85 | Exceptional 5.0% |
Demographics Similar to Paiute by Unemployment
In terms of unemployment, the demographic groups most similar to Paiute are Pueblo (7.2%, a difference of 0.53%), Native/Alaskan (7.0%, a difference of 1.1%), Tsimshian (7.2%, a difference of 1.4%), Immigrants from Armenia (7.0%, a difference of 1.7%), and Alaska Native (7.2%, a difference of 1.8%).
| Demographics | Rating | Rank | Unemployment |
| British West Indians | 0.0 /100 | #319 | Tragic 6.8% |
| Immigrants | St. Vincent and the Grenadines | 0.0 /100 | #320 | Tragic 6.9% |
| Immigrants | Guyana | 0.0 /100 | #321 | Tragic 6.9% |
| Guyanese | 0.0 /100 | #322 | Tragic 6.9% |
| Immigrants | Grenada | 0.0 /100 | #323 | Tragic 6.9% |
| Immigrants | Armenia | 0.0 /100 | #324 | Tragic 7.0% |
| Natives/Alaskans | 0.0 /100 | #325 | Tragic 7.0% |
| Paiute | 0.0 /100 | #326 | Tragic 7.1% |
| Pueblo | 0.0 /100 | #327 | Tragic 7.2% |
| Tsimshian | 0.0 /100 | #328 | Tragic 7.2% |
| Alaska Natives | 0.0 /100 | #329 | Tragic 7.2% |
| Yakama | 0.0 /100 | #330 | Tragic 7.3% |
| Dominicans | 0.0 /100 | #331 | Tragic 7.4% |
| Sioux | 0.0 /100 | #332 | Tragic 7.4% |
| Immigrants | Dominican Republic | 0.0 /100 | #333 | Tragic 7.4% |