Norwegian vs Chickasaw Unemployment Among Seniors over 75 years
COMPARE
Norwegian
Chickasaw
Unemployment Among Seniors over 75 years
Unemployment Among Seniors over 75 years Comparison
Norwegians
Chickasaw
9.8%
UNEMPLOYMENT AMONG SENIORS OVER 75 YEARS
0.0/ 100
METRIC RATING
293rd/ 347
METRIC RANK
7.3%
UNEMPLOYMENT AMONG SENIORS OVER 75 YEARS
100.0/ 100
METRIC RATING
21st/ 347
METRIC RANK
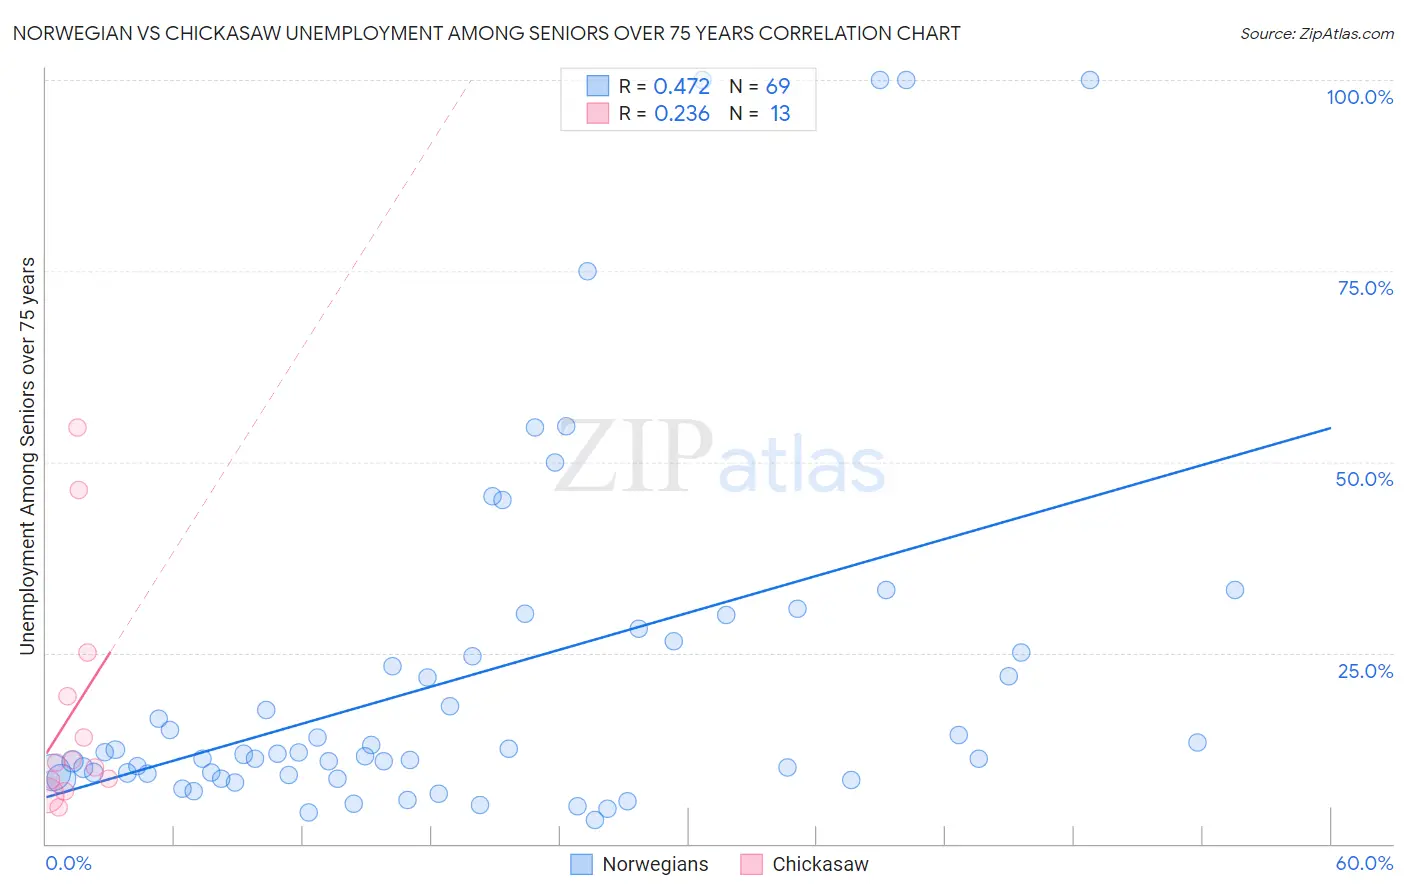
Norwegian vs Chickasaw Unemployment Among Seniors over 75 years Correlation Chart
The statistical analysis conducted on geographies consisting of 229,000,677 people shows a moderate positive correlation between the proportion of Norwegians and unemployment rate among seniors over the age of 75 in the United States with a correlation coefficient (R) of 0.472 and weighted average of 9.8%. Similarly, the statistical analysis conducted on geographies consisting of 100,989,035 people shows a weak positive correlation between the proportion of Chickasaw and unemployment rate among seniors over the age of 75 in the United States with a correlation coefficient (R) of 0.236 and weighted average of 7.3%, a difference of 33.3%.
Unemployment Among Seniors over 75 years Correlation Summary
| Measurement | Norwegian | Chickasaw |
| Minimum | 3.1% | 4.7% |
| Maximum | 100.0% | 54.5% |
| Range | 96.9% | 49.8% |
| Mean | 22.1% | 17.4% |
| Median | 11.7% | 10.7% |
| Interquartile 25% (IQ1) | 9.1% | 7.7% |
| Interquartile 75% (IQ3) | 25.8% | 22.2% |
| Interquartile Range (IQR) | 16.7% | 14.5% |
| Standard Deviation (Sample) | 24.0% | 15.8% |
| Standard Deviation (Population) | 23.8% | 15.1% |
Similar Demographics by Unemployment Among Seniors over 75 years
Demographics Similar to Norwegians by Unemployment Among Seniors over 75 years
In terms of unemployment among seniors over 75 years, the demographic groups most similar to Norwegians are Immigrants from Dominica (9.8%, a difference of 0.060%), Immigrants from Western Africa (9.8%, a difference of 0.17%), Nonimmigrants (9.8%, a difference of 0.42%), Scandinavian (9.7%, a difference of 0.46%), and Immigrants from St. Vincent and the Grenadines (9.8%, a difference of 0.47%).
| Demographics | Rating | Rank | Unemployment Among Seniors over 75 years |
| Nigerians | 0.0 /100 | #286 | Tragic 9.7% |
| Danes | 0.0 /100 | #287 | Tragic 9.7% |
| Canadians | 0.0 /100 | #288 | Tragic 9.7% |
| Czechs | 0.0 /100 | #289 | Tragic 9.7% |
| Sioux | 0.0 /100 | #290 | Tragic 9.7% |
| Scandinavians | 0.0 /100 | #291 | Tragic 9.7% |
| Immigrants | Western Africa | 0.0 /100 | #292 | Tragic 9.8% |
| Norwegians | 0.0 /100 | #293 | Tragic 9.8% |
| Immigrants | Dominica | 0.0 /100 | #294 | Tragic 9.8% |
| Immigrants | Nonimmigrants | 0.0 /100 | #295 | Tragic 9.8% |
| Immigrants | St. Vincent and the Grenadines | 0.0 /100 | #296 | Tragic 9.8% |
| Cherokee | 0.0 /100 | #297 | Tragic 9.8% |
| Lithuanians | 0.0 /100 | #298 | Tragic 9.9% |
| Belgians | 0.0 /100 | #299 | Tragic 9.9% |
| Iraqis | 0.0 /100 | #300 | Tragic 9.9% |
Demographics Similar to Chickasaw by Unemployment Among Seniors over 75 years
In terms of unemployment among seniors over 75 years, the demographic groups most similar to Chickasaw are Cypriot (7.4%, a difference of 0.76%), Israeli (7.4%, a difference of 1.1%), Immigrants from Cuba (7.4%, a difference of 1.2%), Armenian (7.2%, a difference of 1.4%), and Immigrants from Zaire (7.2%, a difference of 1.7%).
| Demographics | Rating | Rank | Unemployment Among Seniors over 75 years |
| Ute | 100.0 /100 | #14 | Exceptional 6.8% |
| Icelanders | 100.0 /100 | #15 | Exceptional 7.0% |
| Seminole | 100.0 /100 | #16 | Exceptional 7.1% |
| Immigrants | Switzerland | 100.0 /100 | #17 | Exceptional 7.2% |
| Immigrants | Uzbekistan | 100.0 /100 | #18 | Exceptional 7.2% |
| Immigrants | Zaire | 100.0 /100 | #19 | Exceptional 7.2% |
| Armenians | 100.0 /100 | #20 | Exceptional 7.2% |
| Chickasaw | 100.0 /100 | #21 | Exceptional 7.3% |
| Cypriots | 100.0 /100 | #22 | Exceptional 7.4% |
| Israelis | 100.0 /100 | #23 | Exceptional 7.4% |
| Immigrants | Cuba | 100.0 /100 | #24 | Exceptional 7.4% |
| Immigrants | Uruguay | 100.0 /100 | #25 | Exceptional 7.5% |
| South Africans | 100.0 /100 | #26 | Exceptional 7.5% |
| Immigrants | Barbados | 100.0 /100 | #27 | Exceptional 7.6% |
| Immigrants | Israel | 100.0 /100 | #28 | Exceptional 7.6% |